Improving the experience of people facing floods, with personalized alerts and real-time data.
My Roles
Product Design
User Research
Benchmark
Personas
User Journey Map
Wireframes
User Flow
Prototypes
User Interface
User Tests
This project was designed to provide a technological solution aimed at improving the safety and quality of life of the communities living along the banks of the Rio Doce, in the municipality of Governador Valadares.
The application was created to simplify and make river level monitoring more accurate, providing real-time information that helps residents and local authorities make preventive decisions. In doing so, it seeks to reduce the risks of material and physical losses, as well as minimize the psychological impacts related to anxiety and stress caused by floods.
The initiative emerged from the need for reliable and centralized data on the river’s behavior, filling a gap in the region. The application will allow users to monitor flood levels, receive automated alerts, and access practical safety guidelines, promoting greater predictability and peace of mind for the population.
Challenge
Currently, ANA (the National Water Agency), through the National Hydrometeorological Network (RHN), has 4,641 monitoring points divided into stations that track parameters related to Brazil’s 1,874 rivers.
For those living near a river, there is the constant fear of sudden floods that can strike unexpectedly and flood entire streets and neighborhoods. Some online tools allow people to monitor river level variations. However, in my research, I discovered that some of these tools have their data added manually.
The entire experience of these residents is shaped by alerts issued by the city’s civil defense, which are usually broadcast by the media when the river level is already close to overflowing. During a flood, some neighborhoods are affected first, while others remain untouched, requiring a more personalized and localized approach to assessing flood risk in each area.
Goals and Objectives
Using Product Design processes, it is necessary to investigate the needs of users who are part of the riverside communities in the city of Governador Valadares, and to understand how these people relate to changes in the level of the Rio Doce during flood periods and how they monitor its evolution. In addition, it is important to understand how these changes impact their daily lives during times of risk. Based on the insights obtained in these stages, a solution should be developed that enables residents to track the river level more accurately, anytime and anywhere. This solution should also provide tools and information that improve the experience of residents in areas near rivers, while minimizing as much as possible the risks of material losses, as well as harm to people’s health and lives.
Aprendendo com os usuários
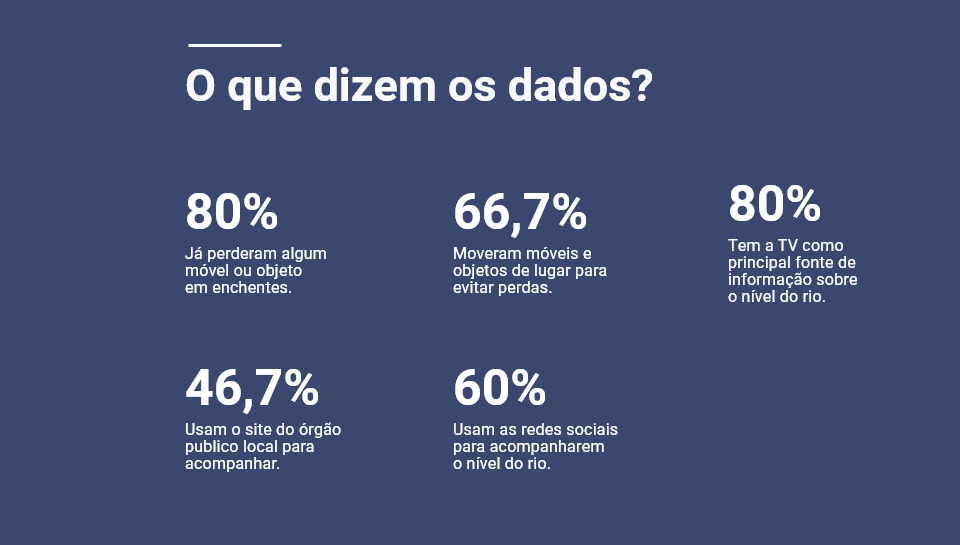
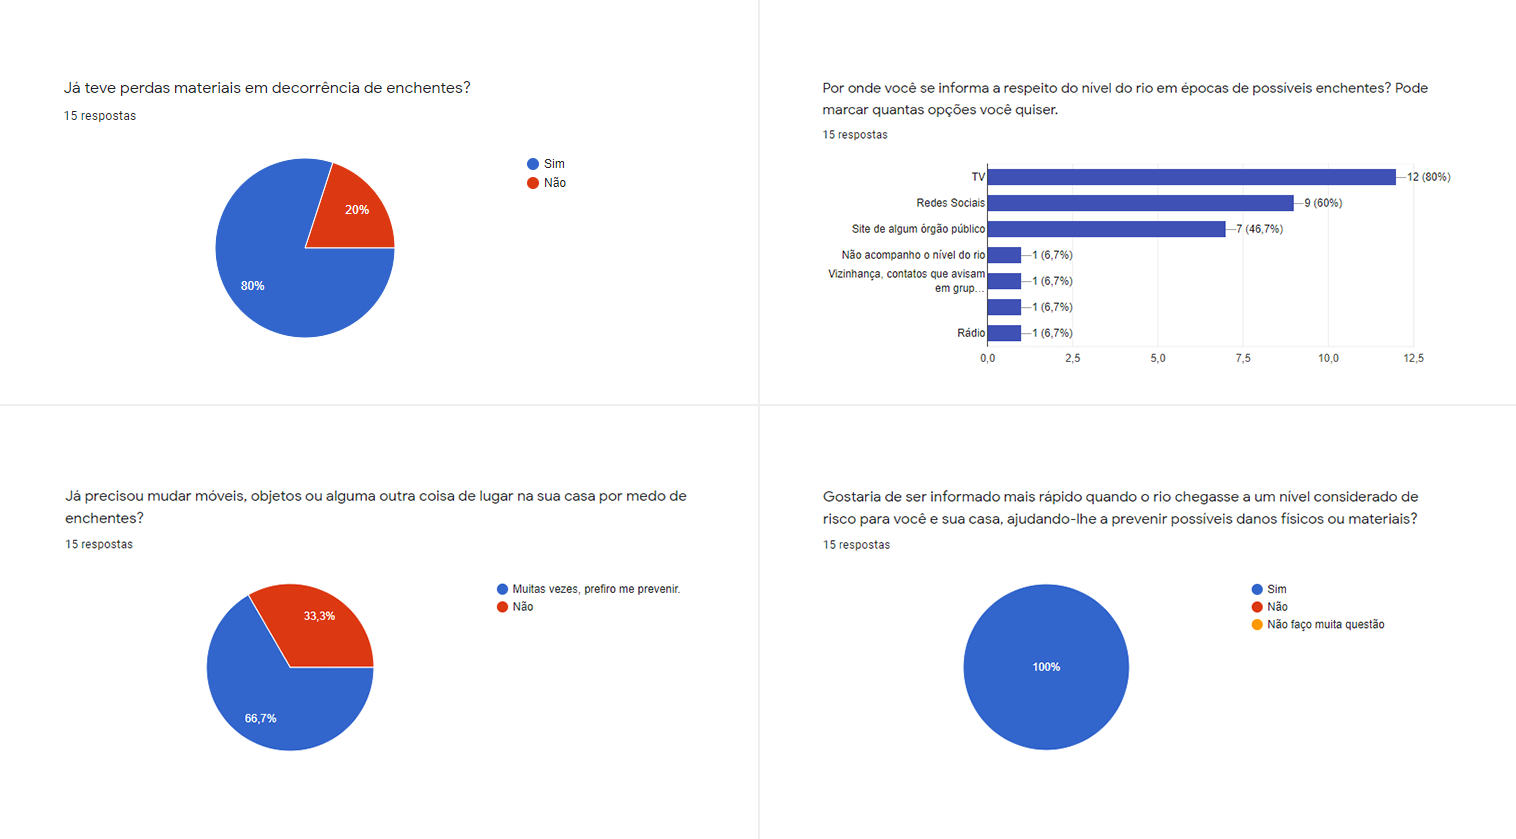
To understand the impacts that flood risks and actual floods have on the lives of residents living near the rivers, I conducted a quantitative study that allowed me to better understand how these people have been affected by this issue. This information enabled me to quantitatively explore scenarios and specific situations I had not previously considered, while also providing a deeper understanding of the impacts and disruptions that floods cause in people’s daily lives during high-water periods.
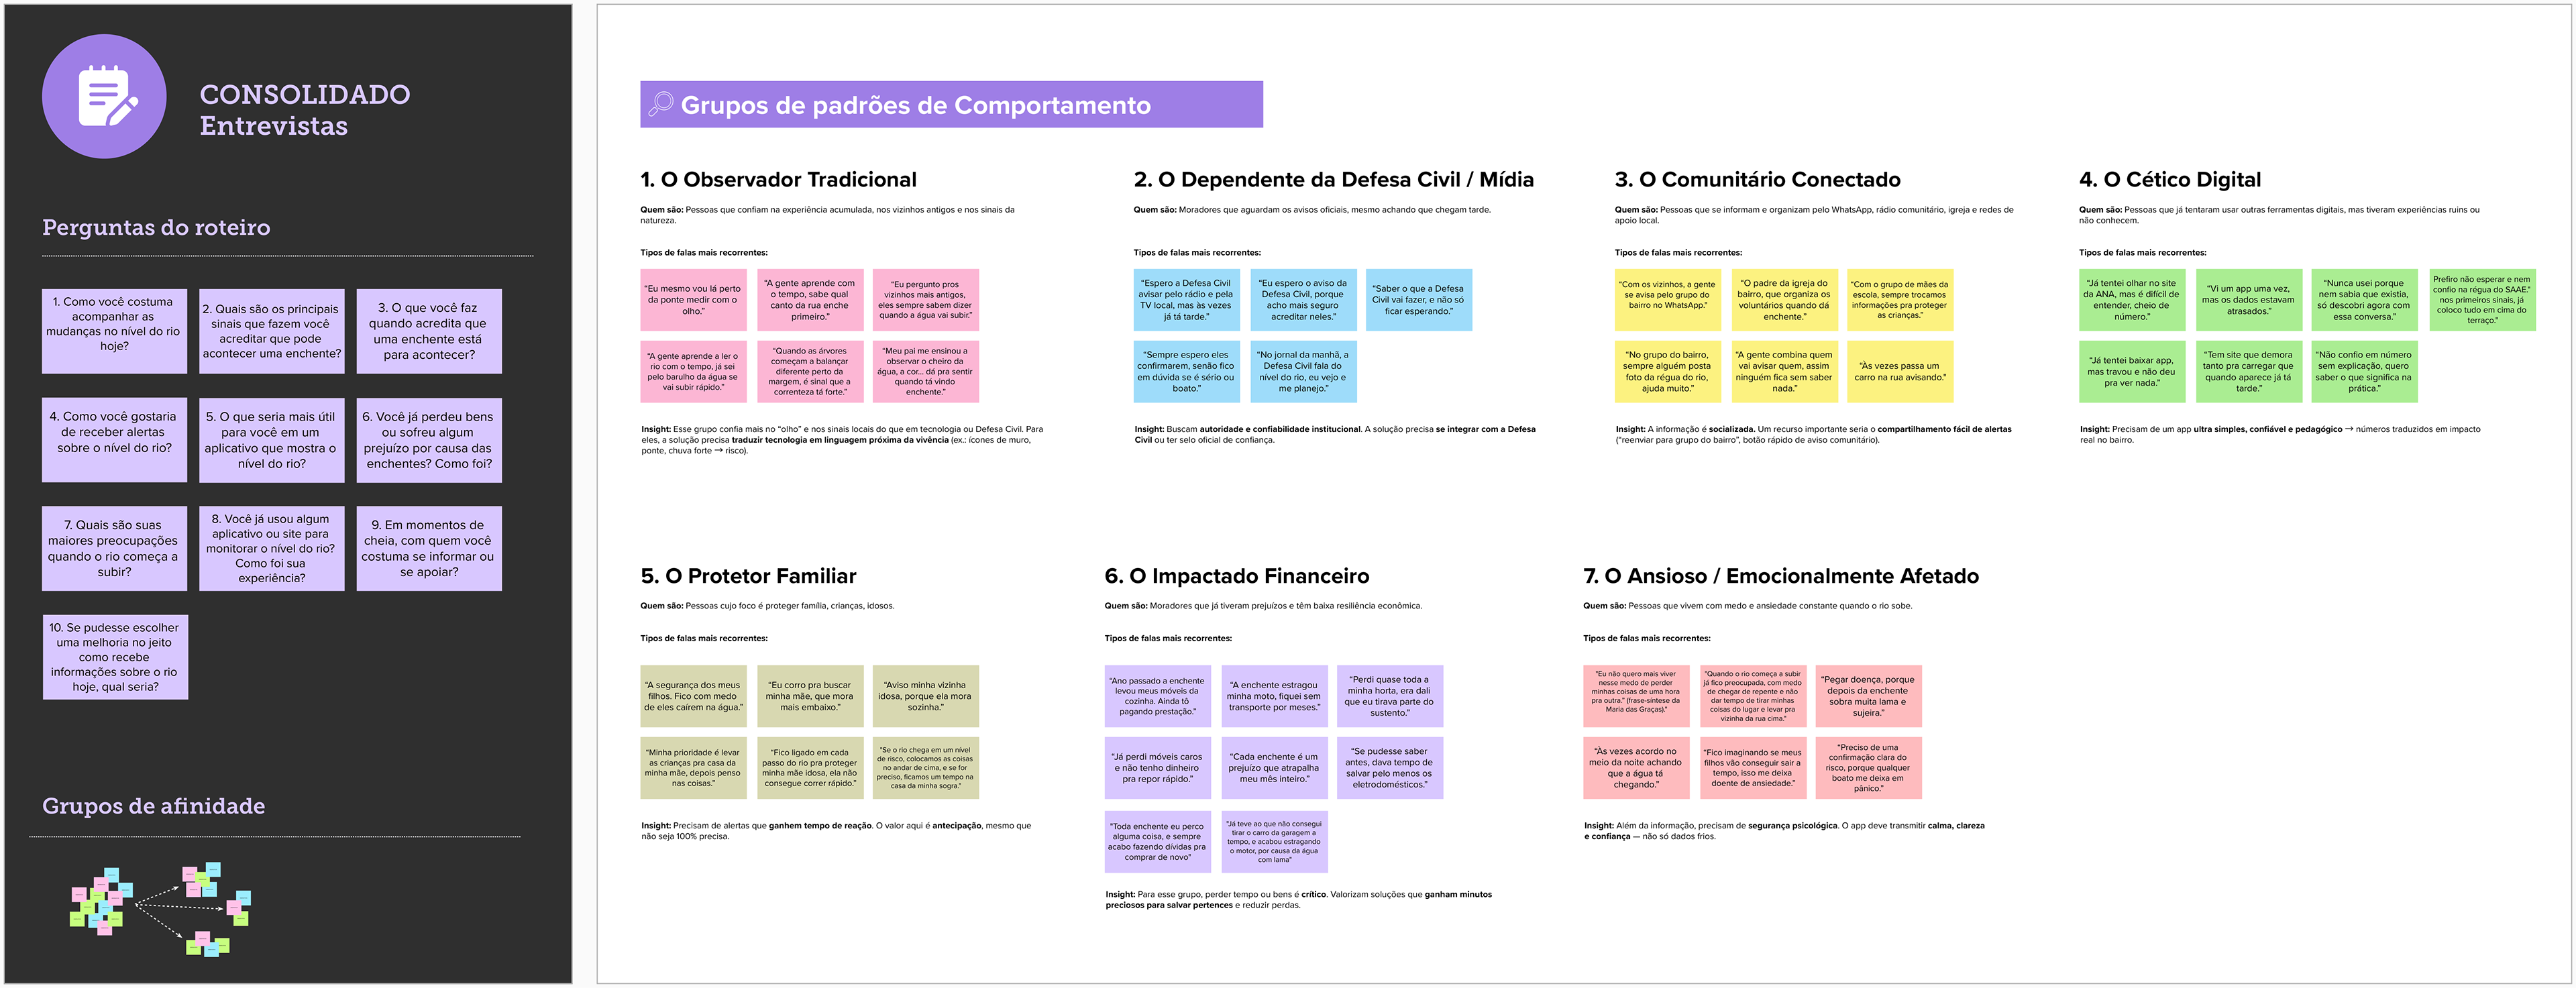
To gain a deeper understanding of the experiences, perceptions, and needs of residents living along the riverbanks, I conducted field interviews directly with these individuals. This qualitative method allowed for a detailed exploration of residents’ behaviors, attitudes, and emotions in the face of flood risks, revealing information that would not be captured through quantitative research. The field conversations provided rich insights into how residents monitor the river’s levels, prepare for risky situations, and identify their main concerns, enabling the identification of behavioral patterns, pain points, and expectations that inform the development of more effective, user-centered solutions. Additionally, I was able to witness firsthand the distress these people experience when recalling critical moments during past floods.
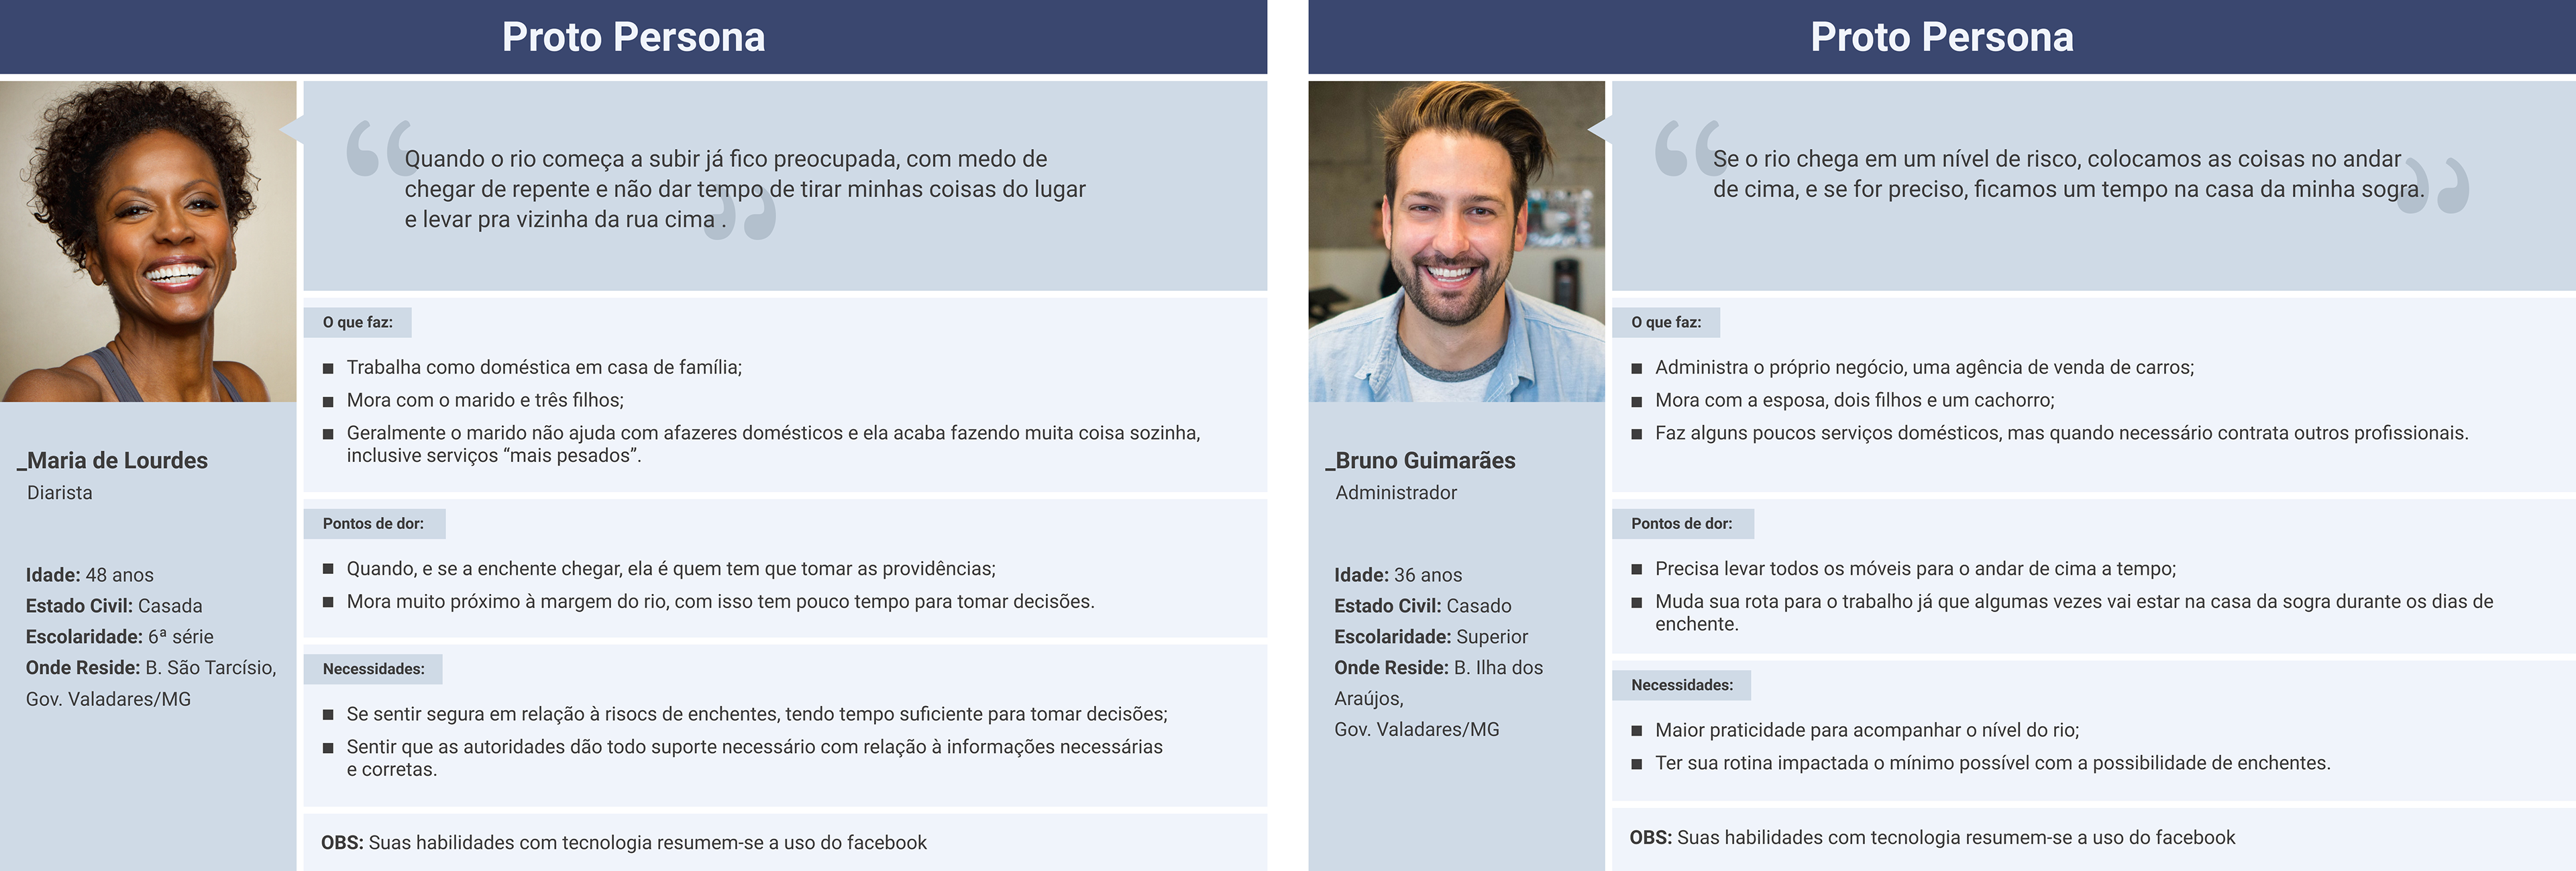
Proto personas
The data collected in the previous stage was used to guide the creation of two personas, which served as user models to define project adaptation criteria and design the experience journeys.
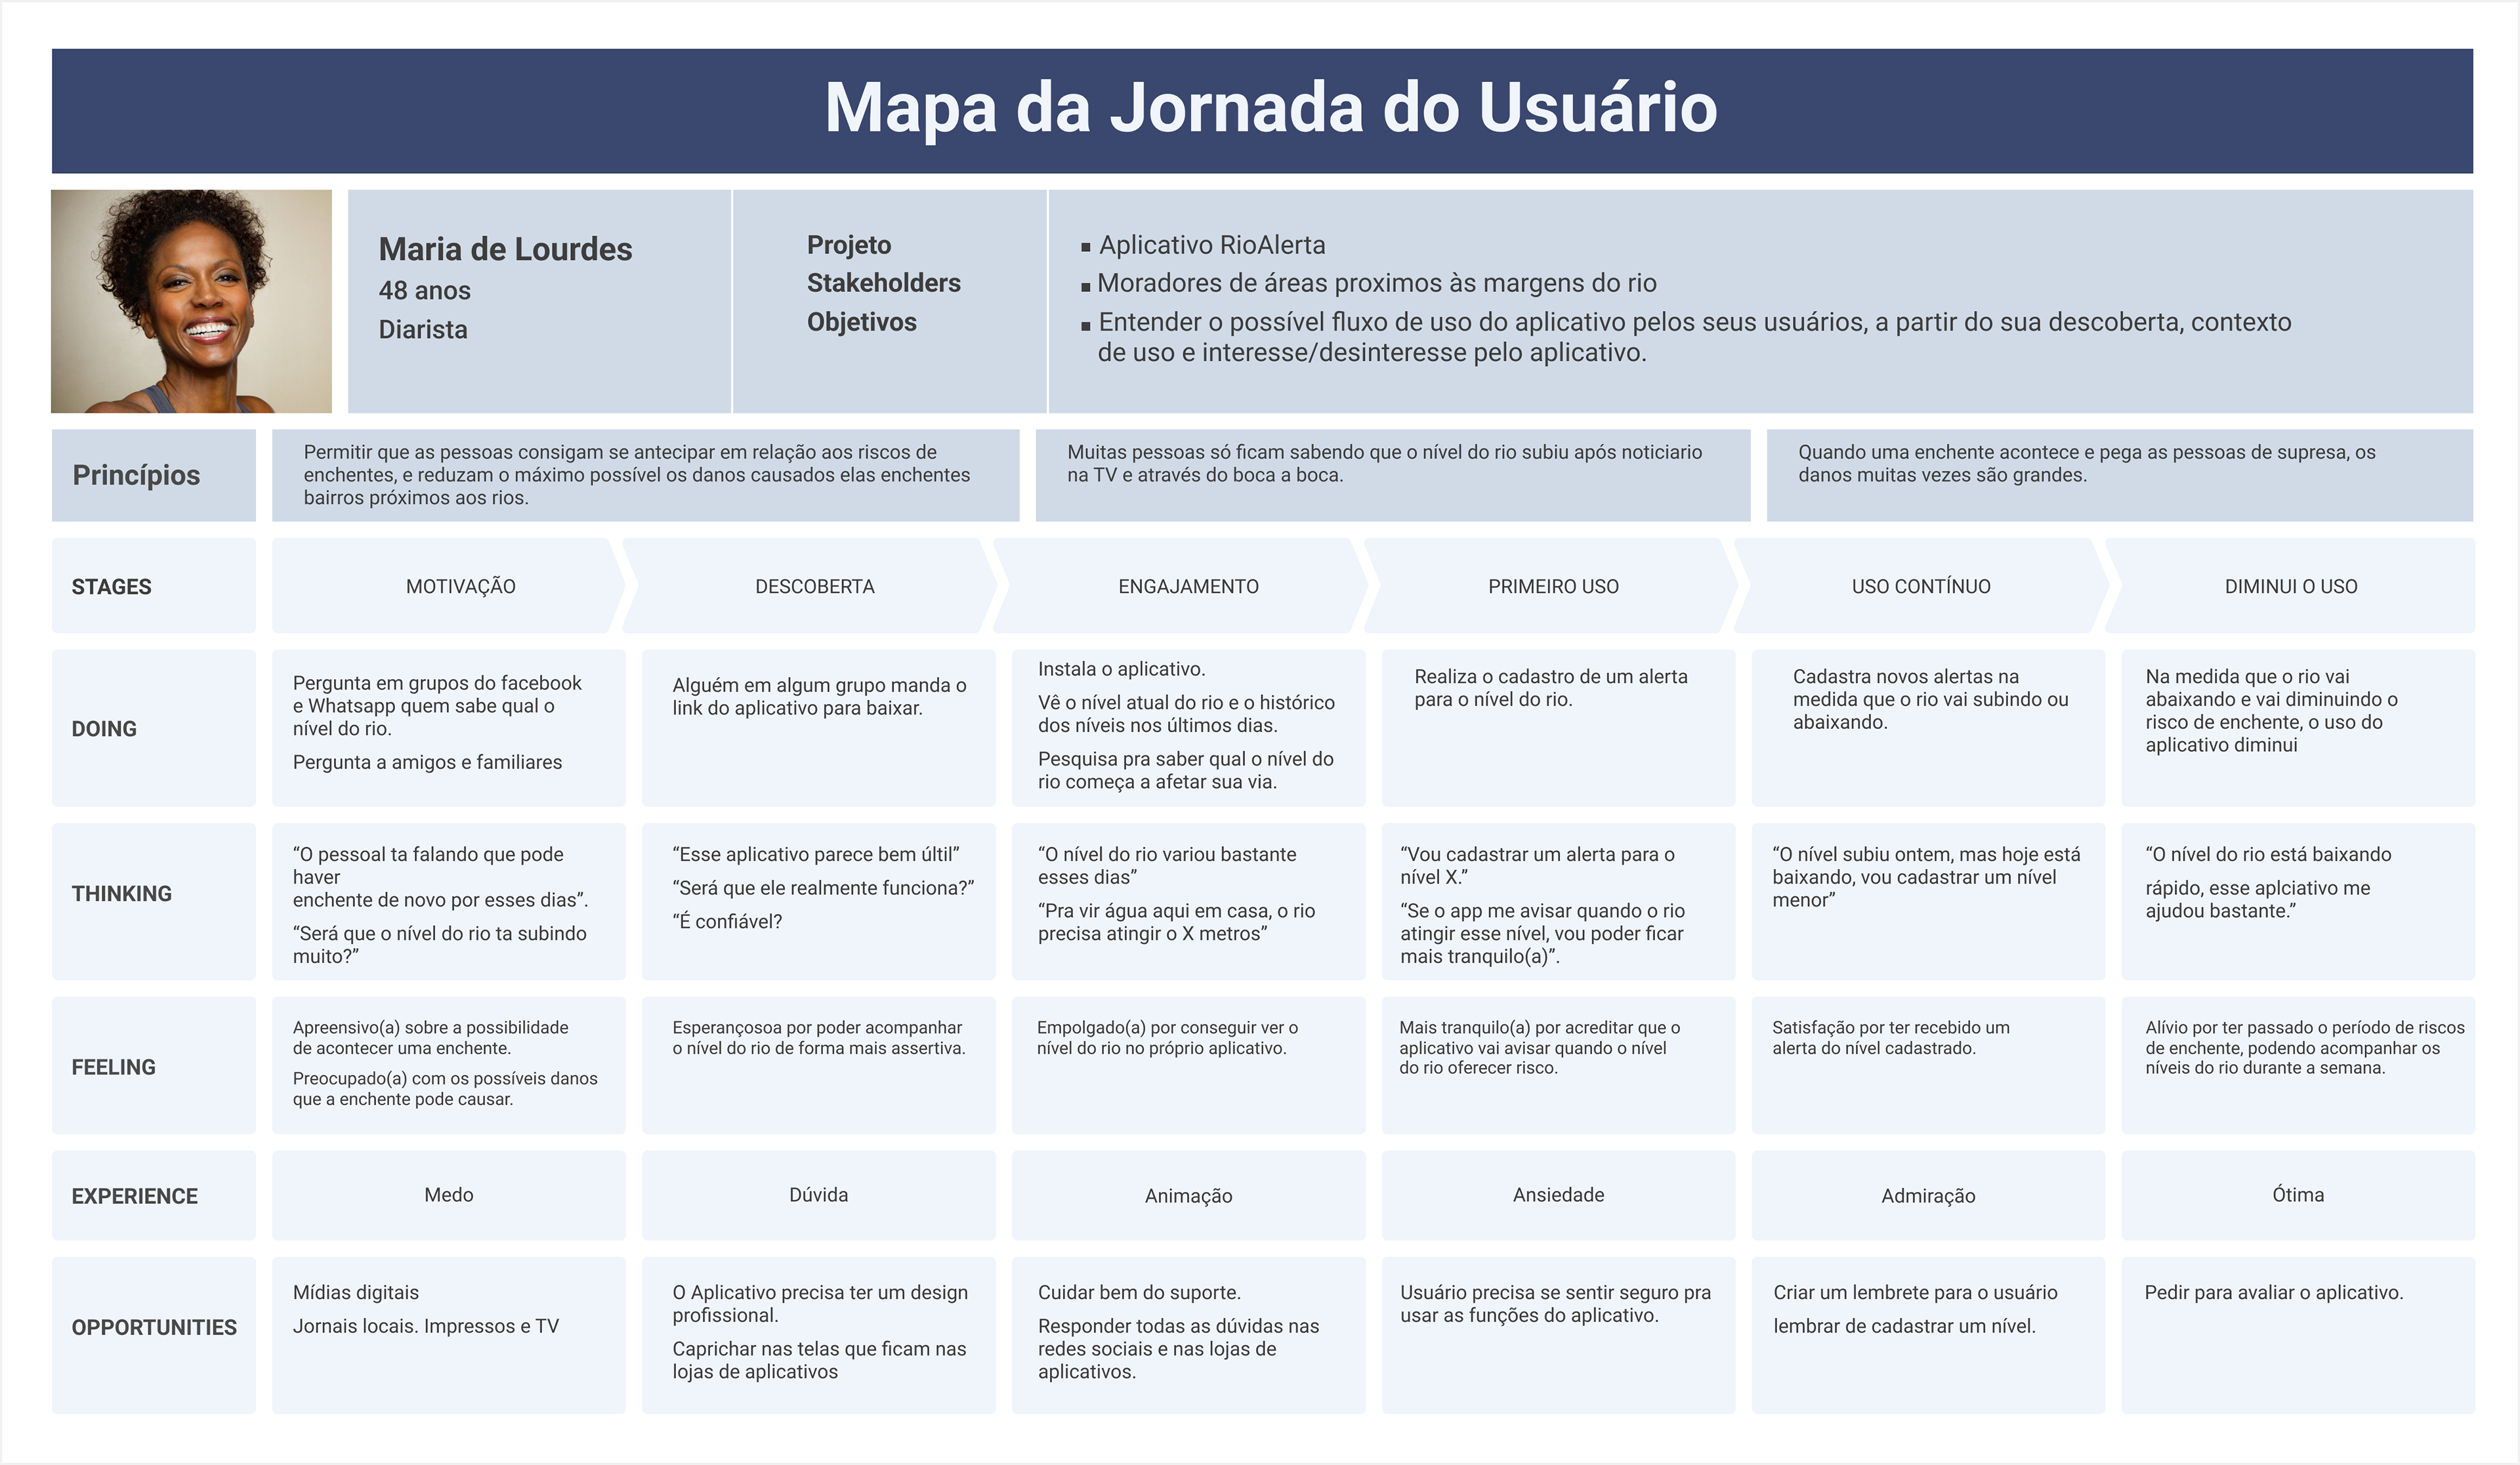
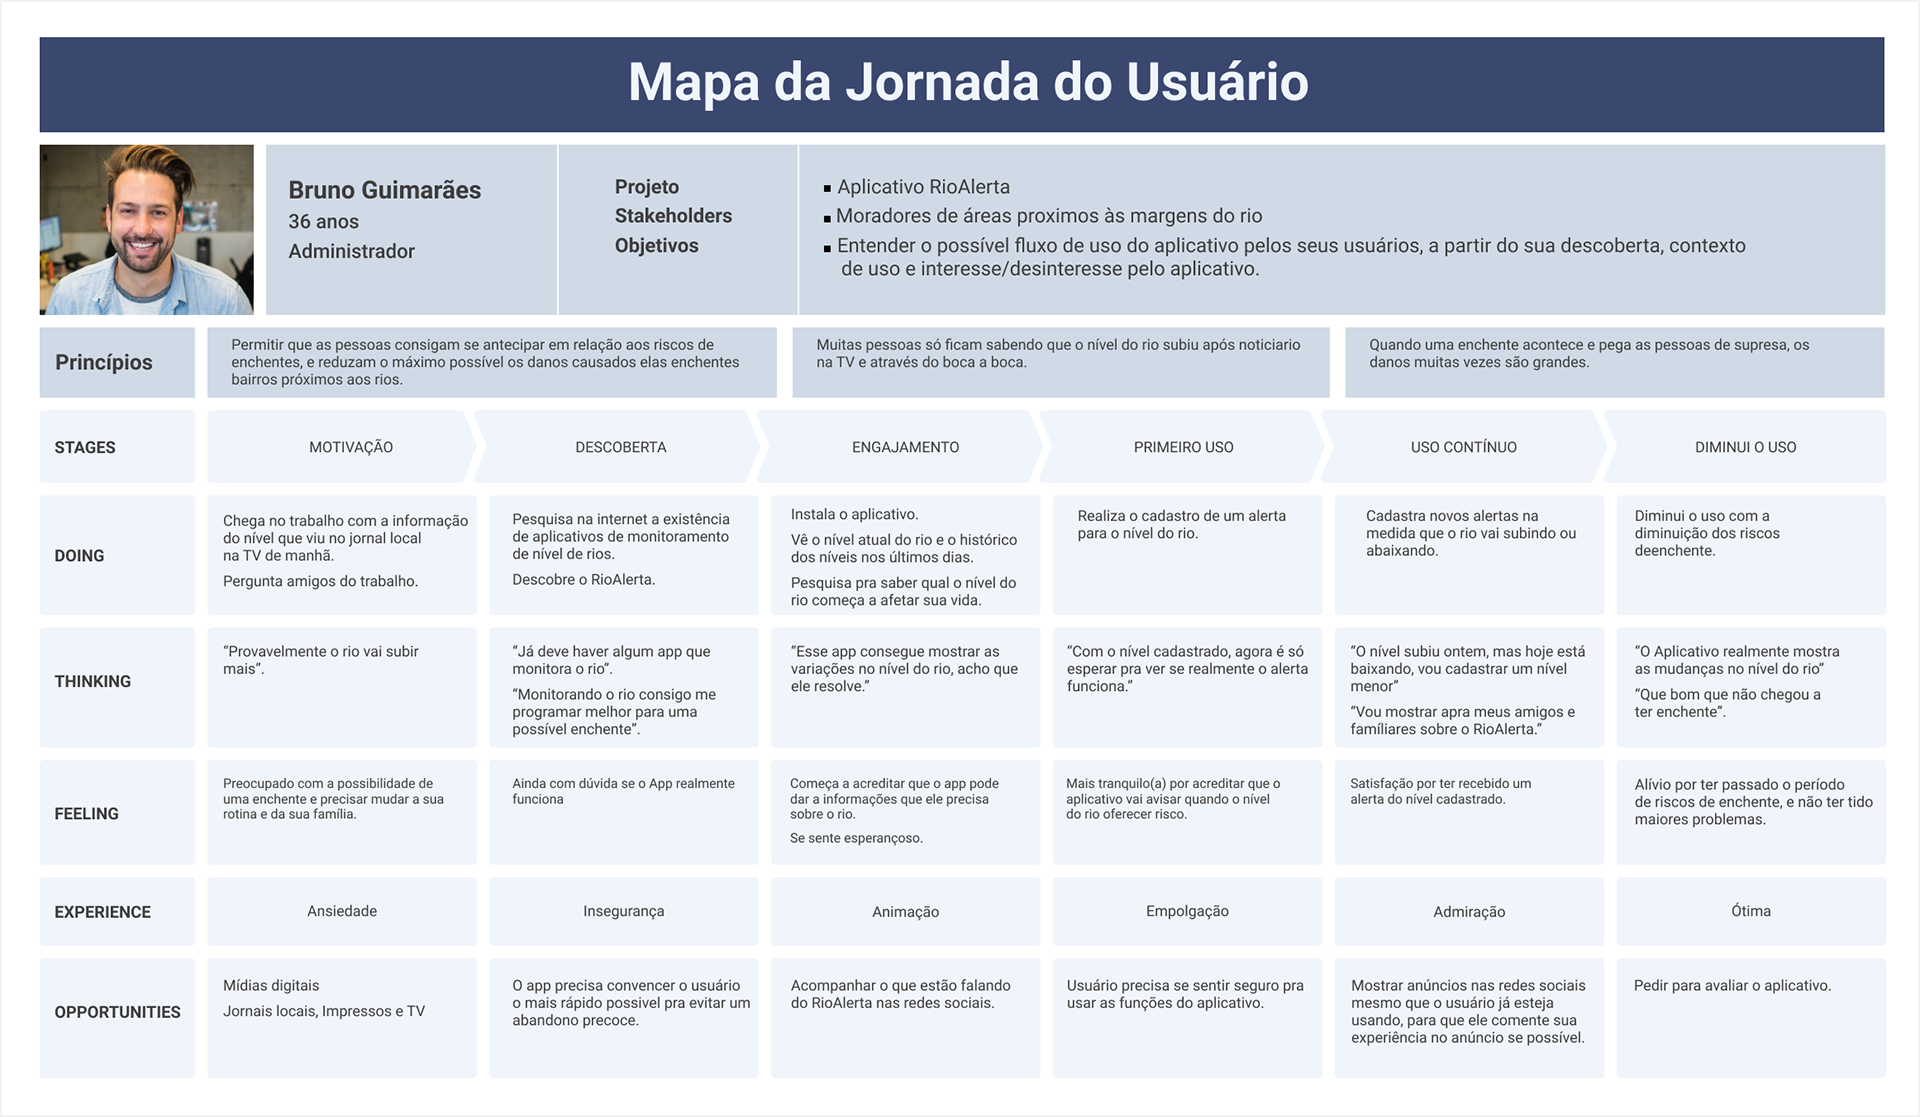
User Journeys
Based on the personas created, two user journey maps were developed to understand their processes, the paths they take, and to explore the user's mental model and behavior patterns during their experience with the problem.
Early Design Explorations
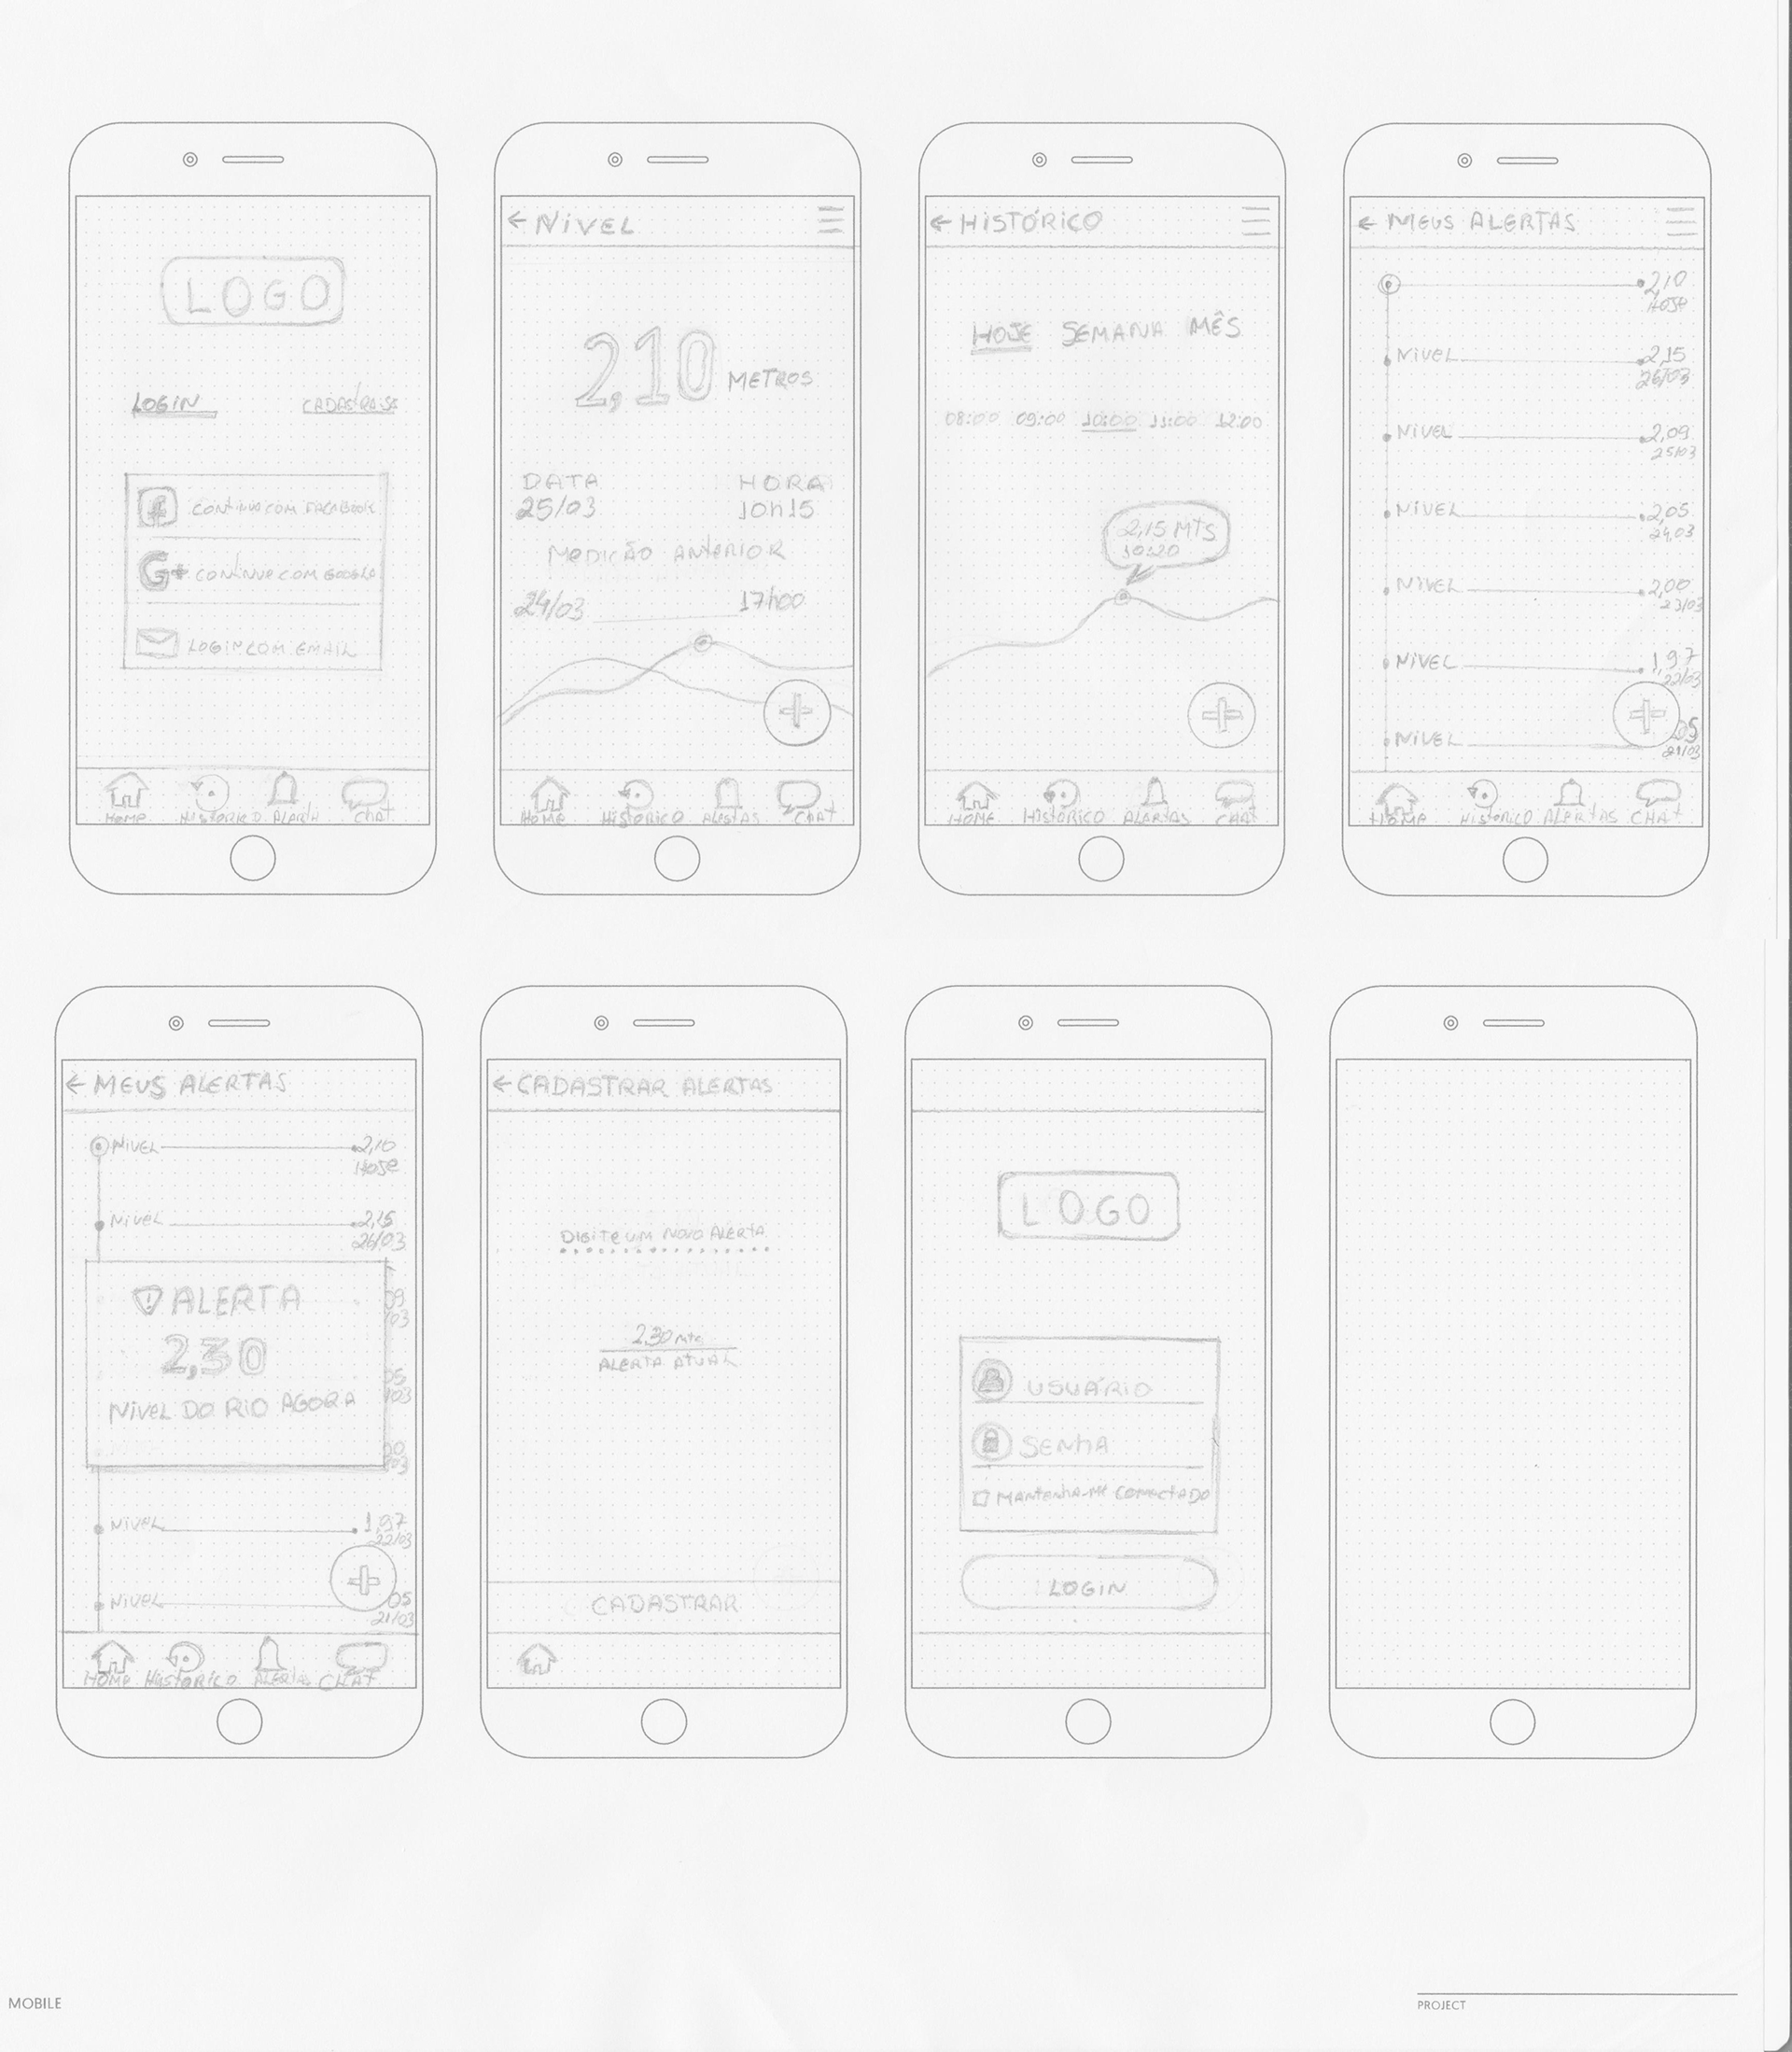
After observing the user journey to understand their desires, behavior patterns, and how they experience the problem in their context, this stage involved creating some sketches to explore interface alternatives and discover features that could meet their needs.
To enhance learning in this stage, a navigable prototype was created with the help of the Marvel app, where some preliminary tests were conducted by me and the team itself, allowing us to identify areas for improvement before creating any high-fidelity prototype.
These sketches were essential for communicating with the team and for testing some potential interaction points of the application.
These sketches were essential for communicating with the team and for testing some potential interaction points of the application.
Detailed Wireframe Development
Before moving on to the high-fidelity prototype, I developed a low-fidelity wireframe to structure the navigation and test the organization of the main interface elements. This step was essential to quickly validate flows, prioritize features, and align the proposal with the team before investing in greater visual detail.
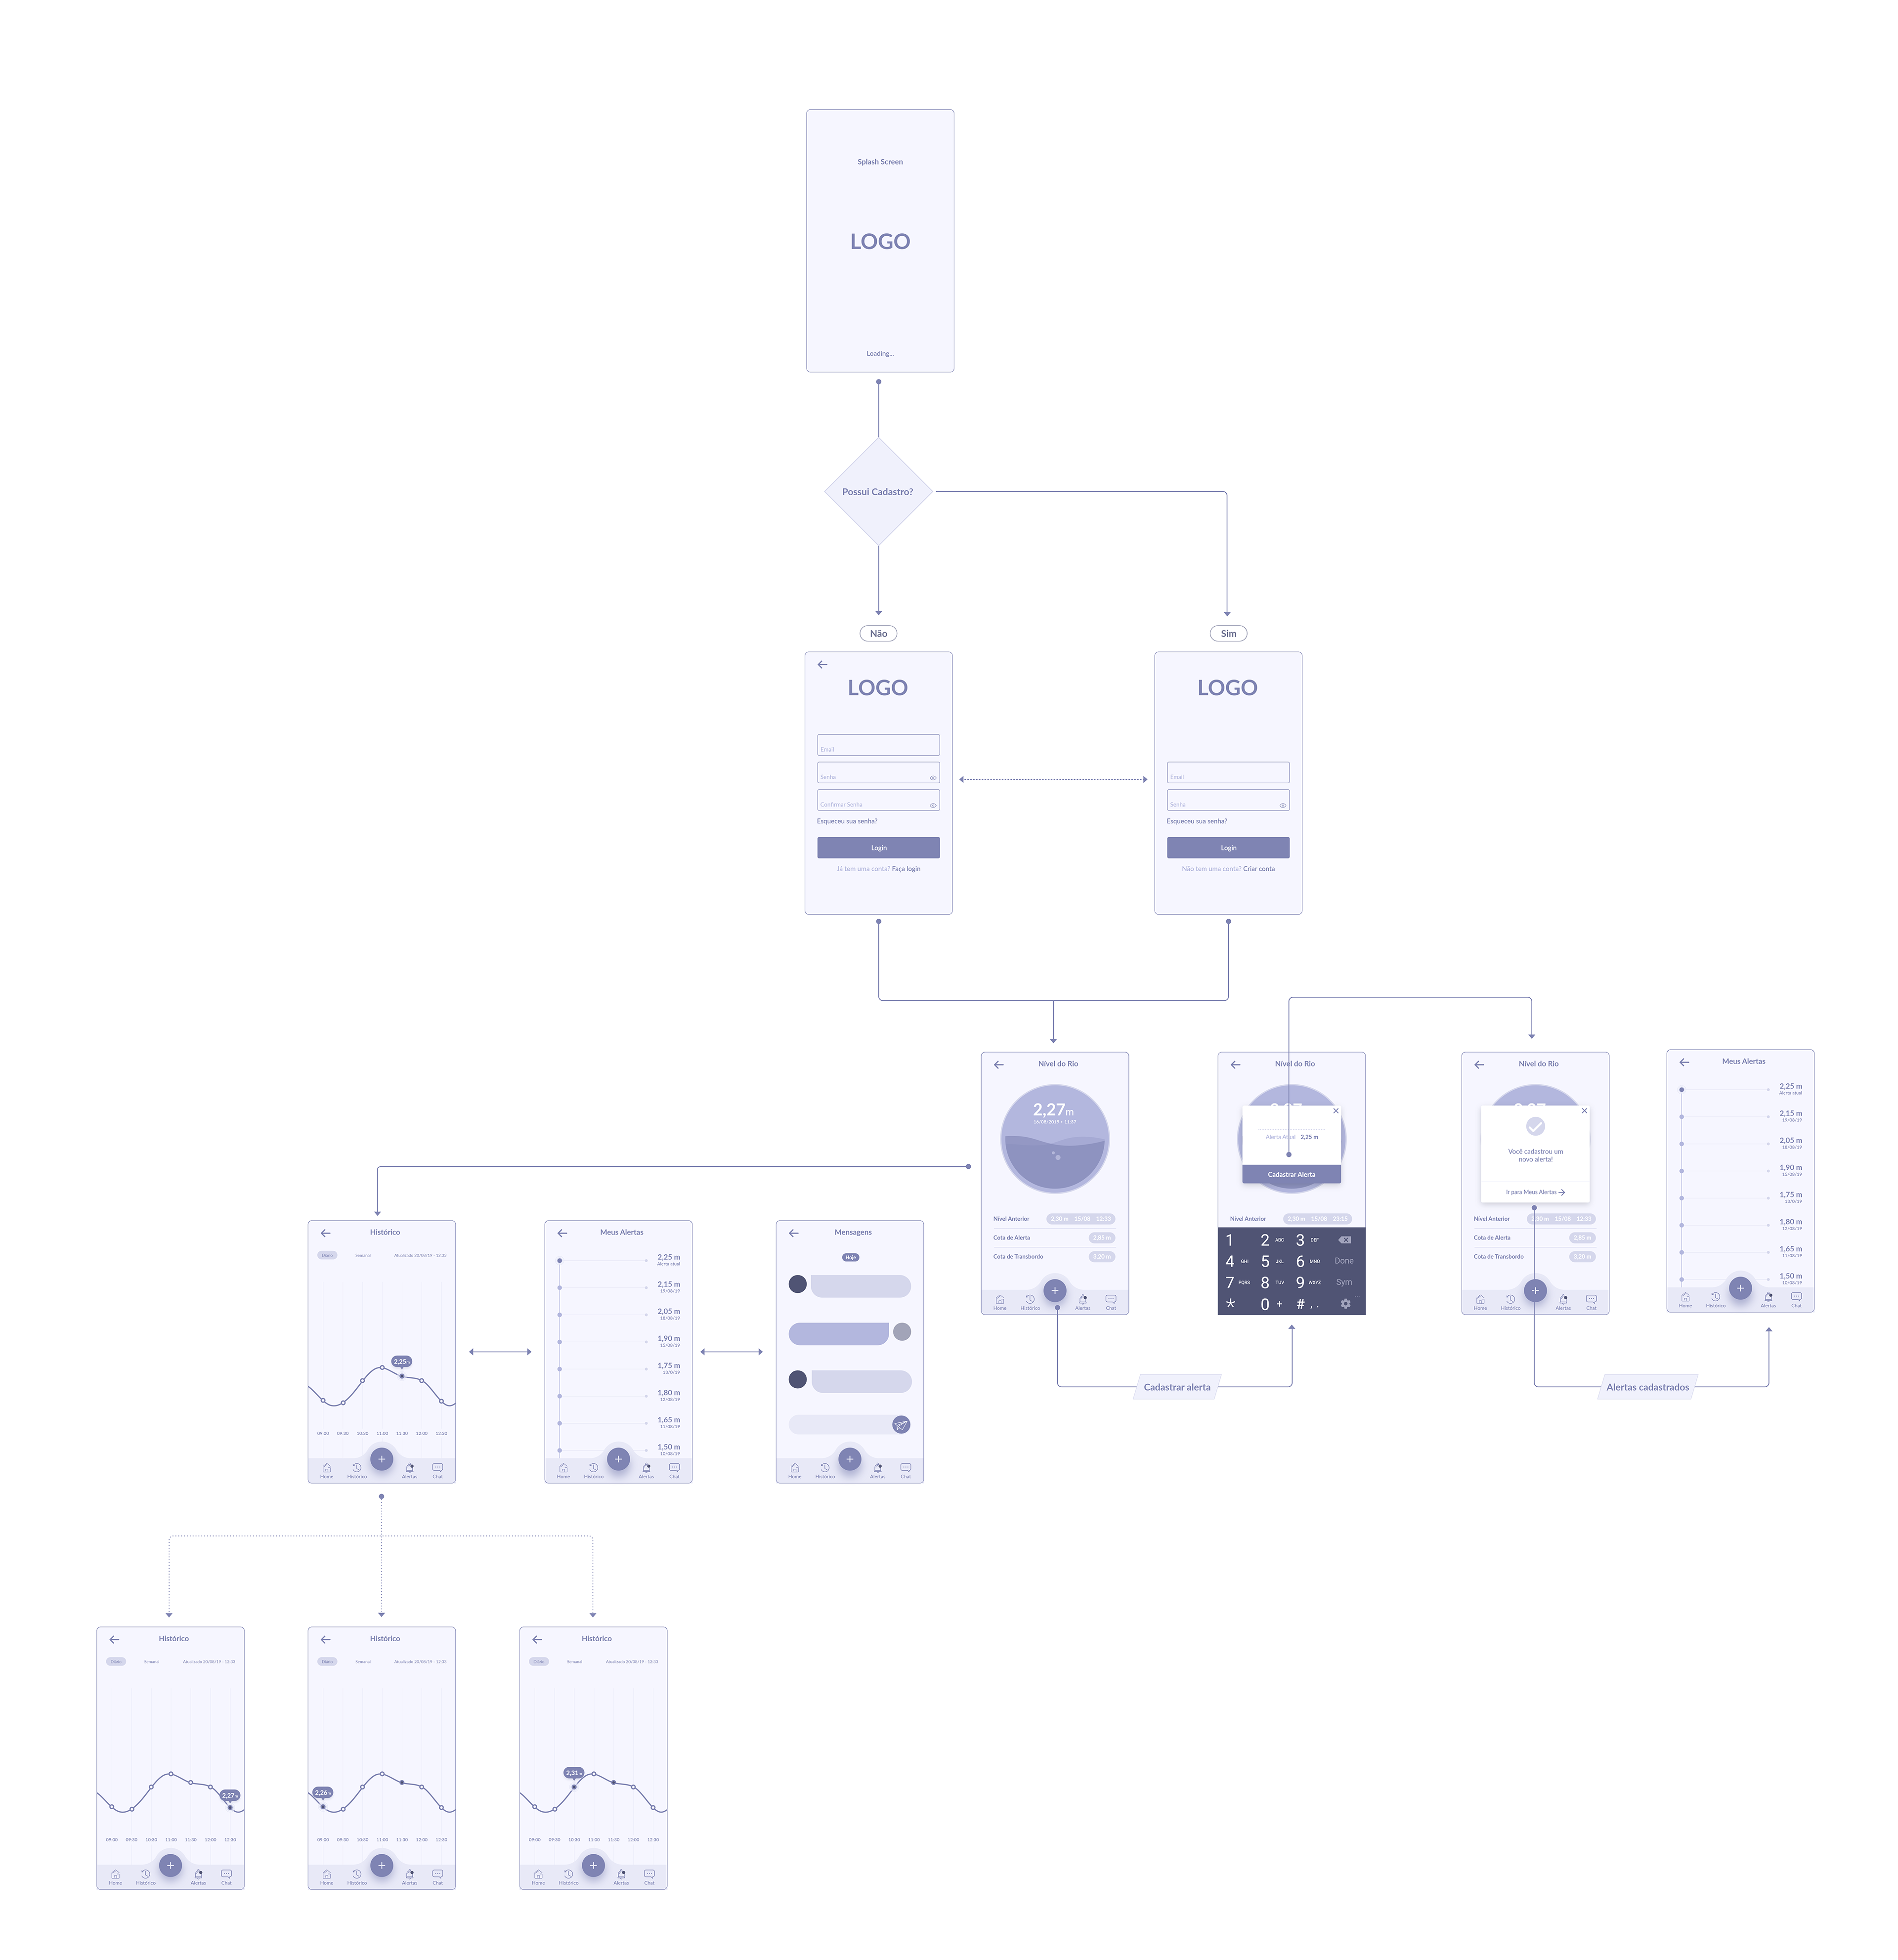
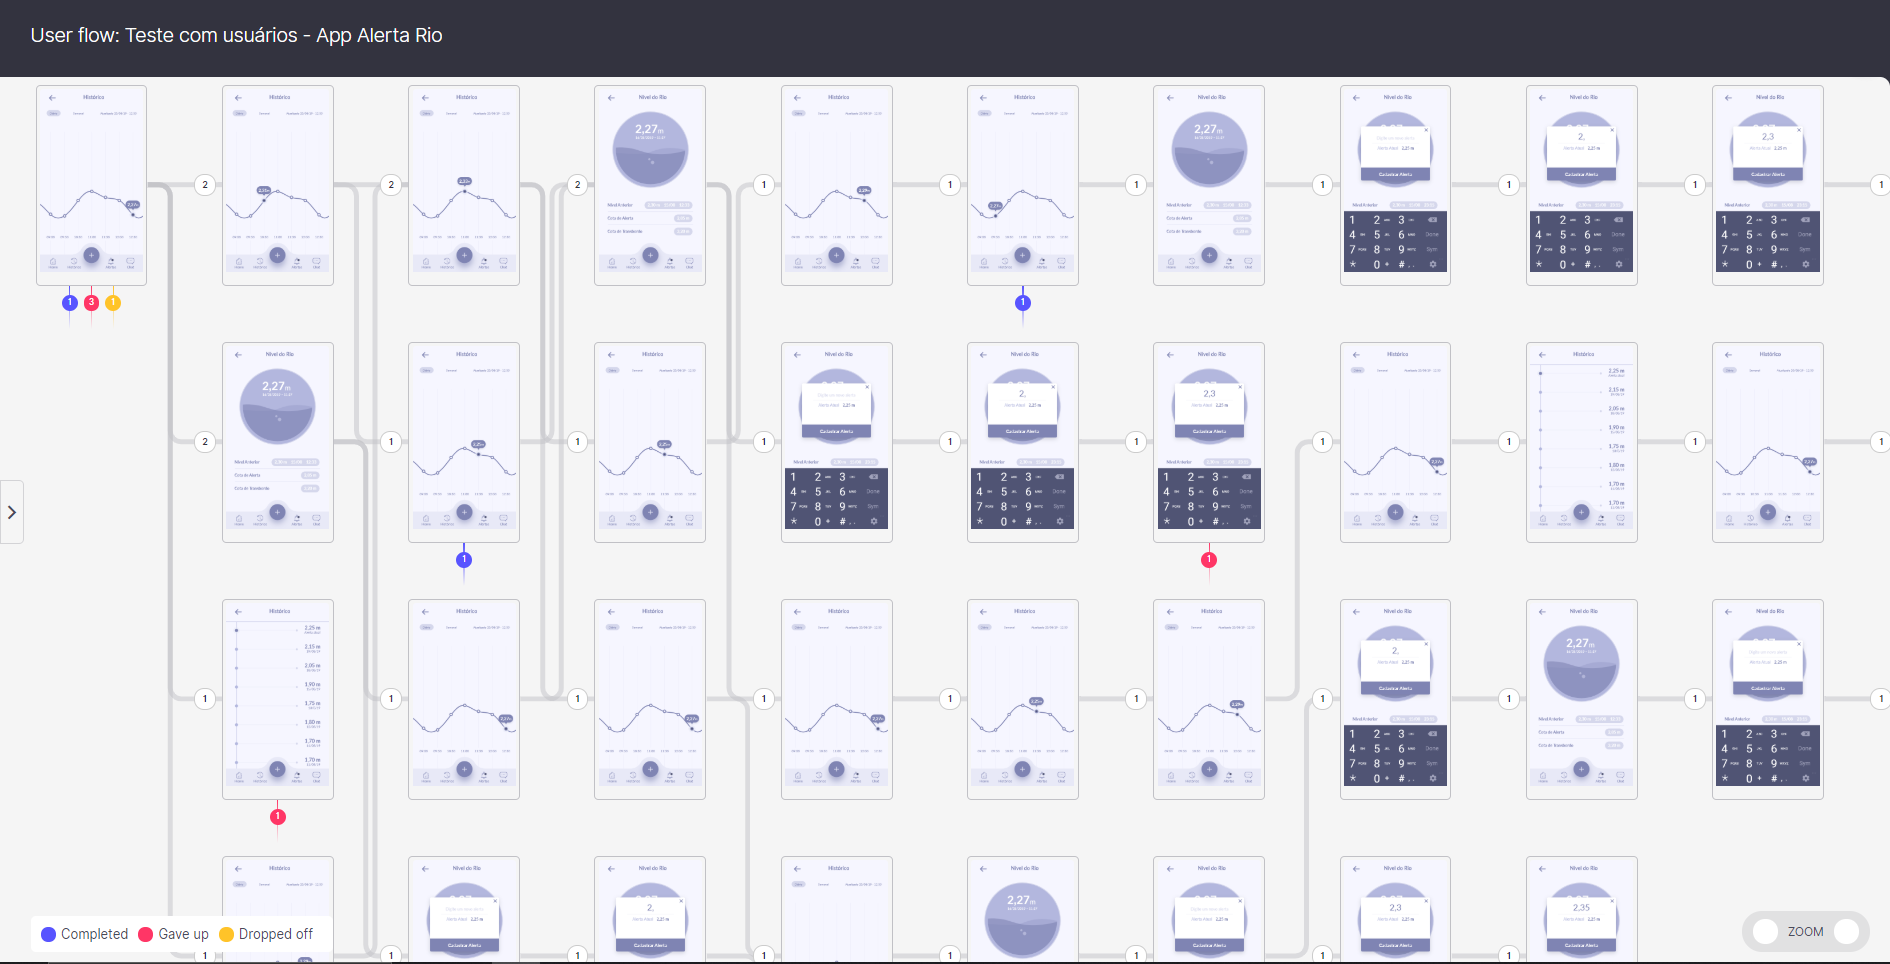
User Flow
At this stage, I designed the user flow to define and evaluate the sequences of interaction and touchpoints within the app. Even in an app with few features initially, this stage is extremely important to assess whether the flow makes sense for the user. It also serves as one of the development guidelines, as it provides a macro view of all the screens that will be necessary and the actions performed in the product.
User Testing
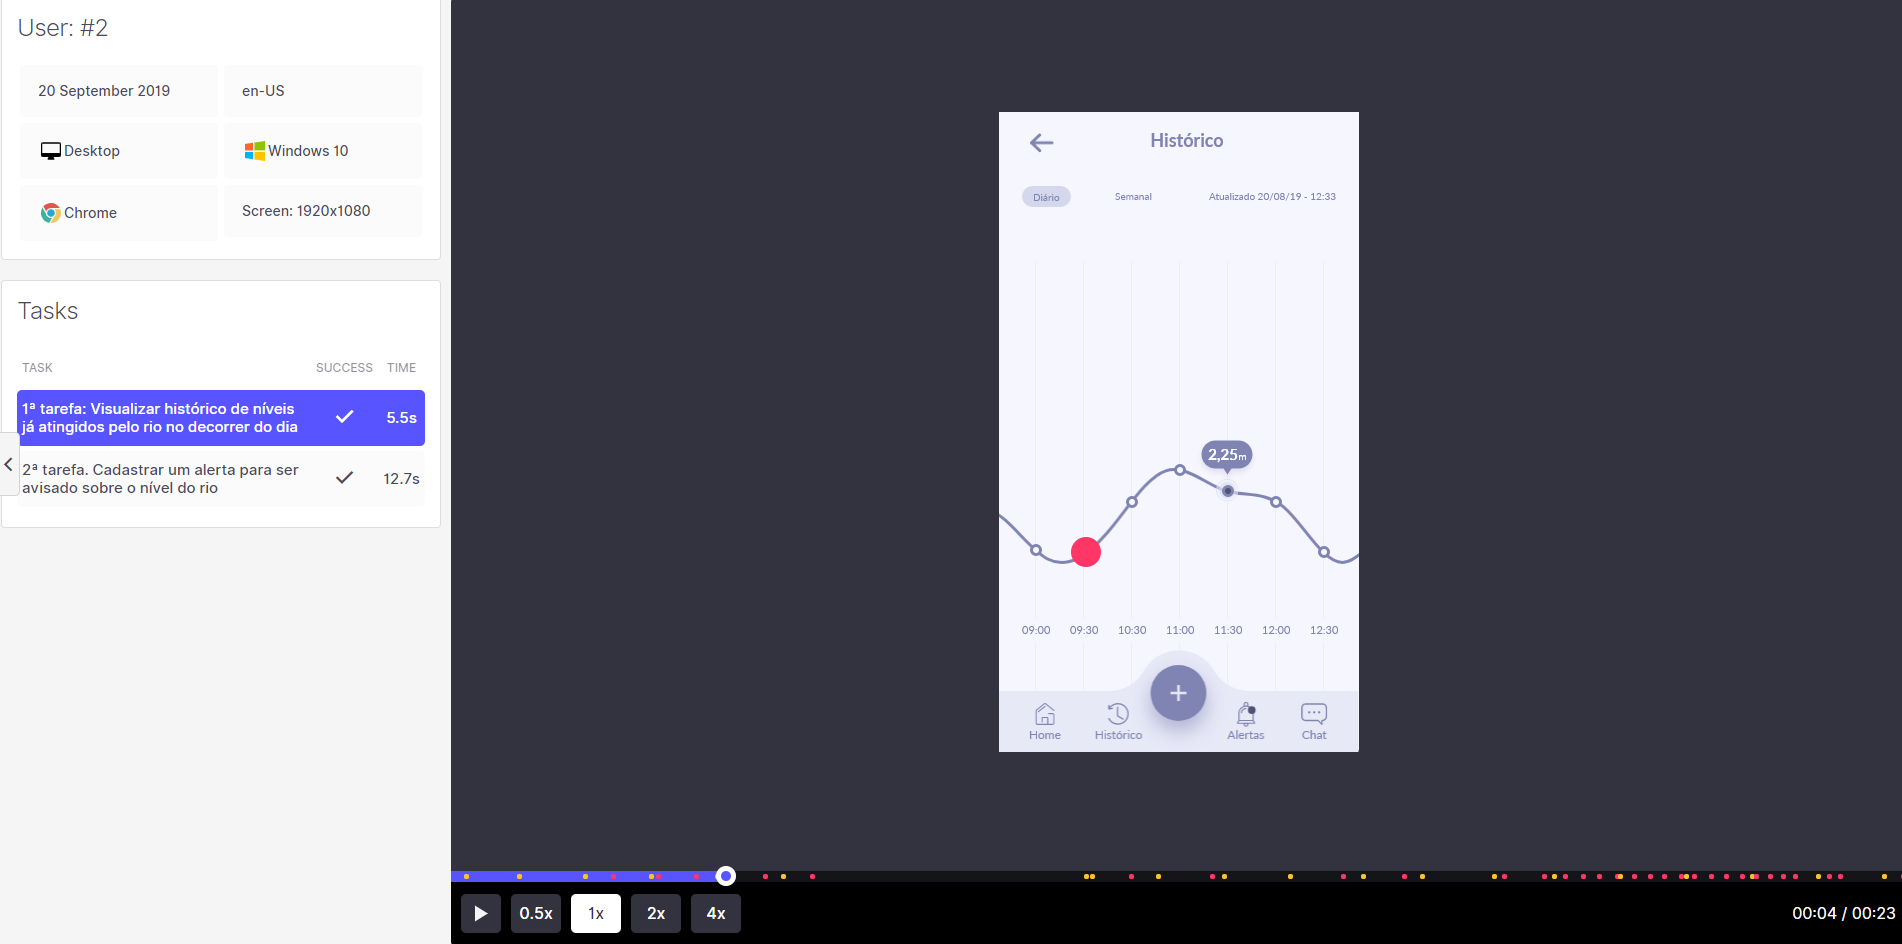
Using the tool useberry.com, I conducted the tests no moderation, using the wireframes developed in the previous stage, which allowed me to identify areas for improvement and usability issues.
1st Task: View the historical river levels reached throughout the day.
2nd Task: Set up a level alert to be notified by the app if the river reaches the set level.
2nd Task: Set up a level alert to be notified by the app if the river reaches the set level.
Lessons Learned
After conducting usability tests to validate the user experience of the application, I gathered valuable feedback that highlighted several key areas for improvement. During this phase, users interacted with the wireframes developed in the previous stages to perform two main tasks:
• View the historical river levels throughout the day.
• Set up level alerts for notifications.
Test Insights
The tests provided insights into the clarity and effectiveness of the design, revealing both strengths and areas that needed refinement:
The tests provided insights into the clarity and effectiveness of the design, revealing both strengths and areas that needed refinement:
• Main Feature: The main feature was well-received, being clear and direct.
• Historical Data Section: People found great value in the history screen, as it allowed them to make assumptions about the river level’s rise speed or progression.
• "Register" Button: The "Register" button, centered between the menus, provided enough emphasis, making it highly noticeable to users.
• Historical Graph: The historical graph was not clear enough to help users easily interpret the time/level relationship.
Next Steps
These insights were crucial for guiding the next steps in refining the app, ensuring a more intuitive and user-friendly experience moving forward.
Final Design
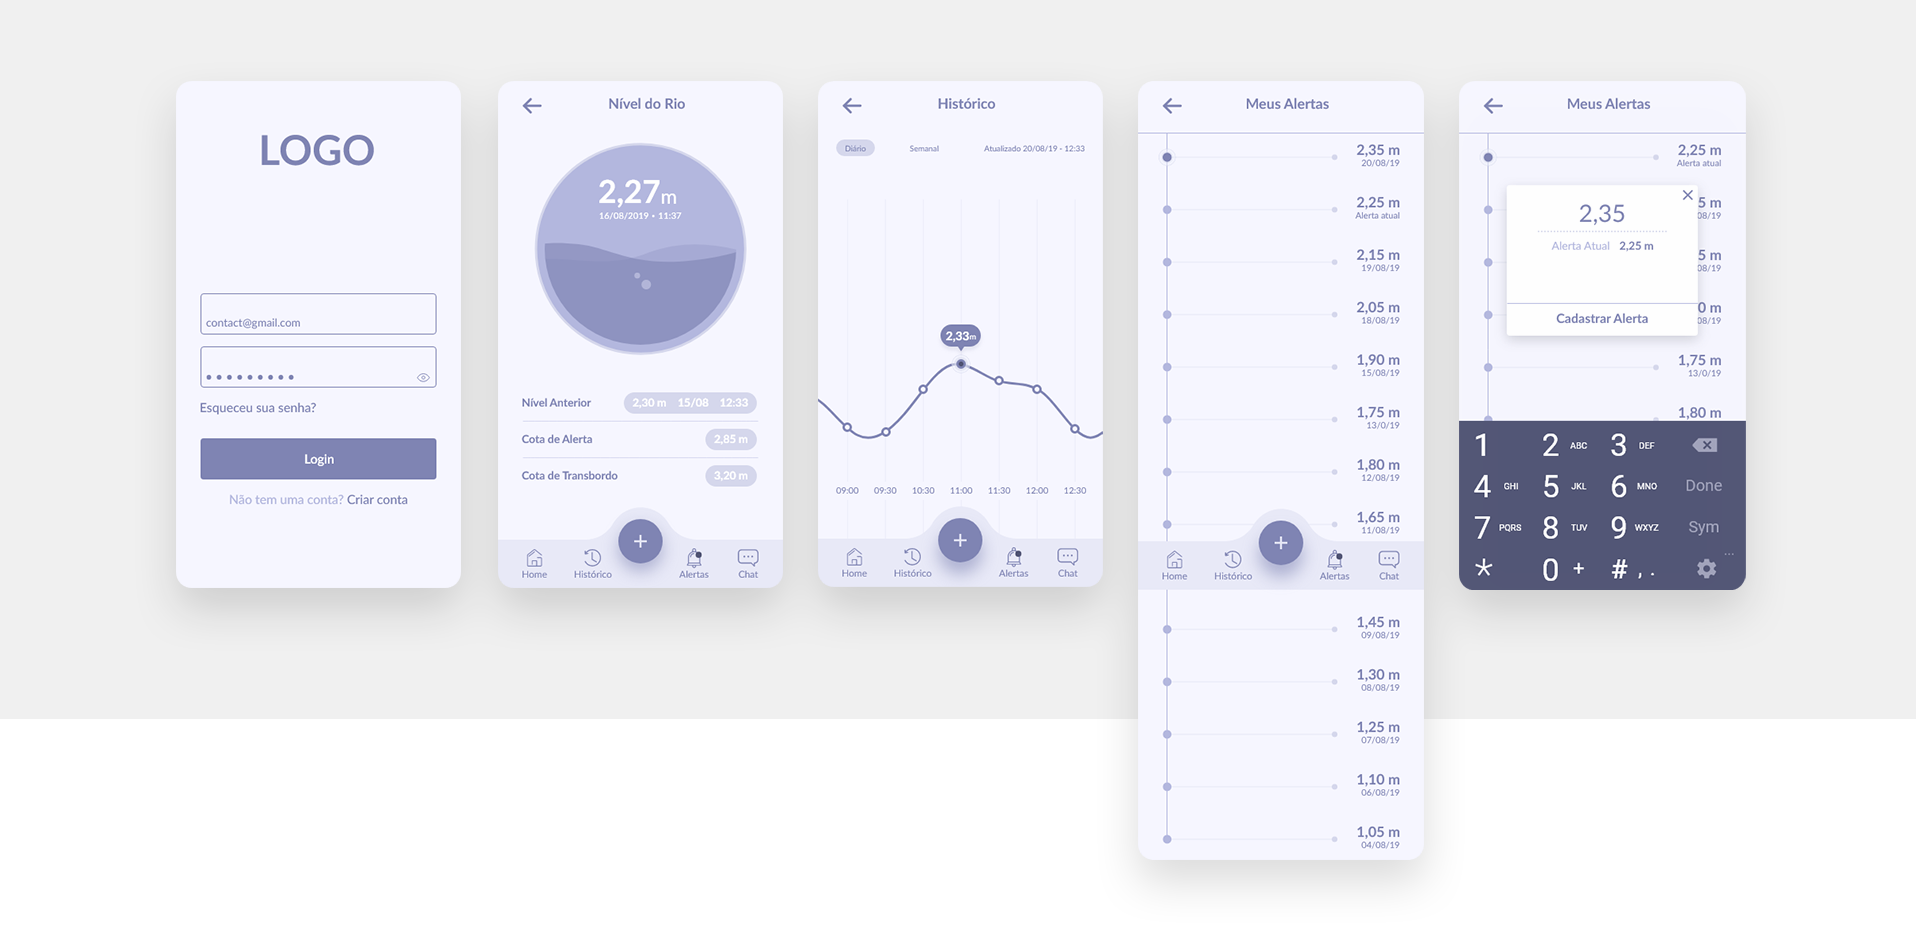
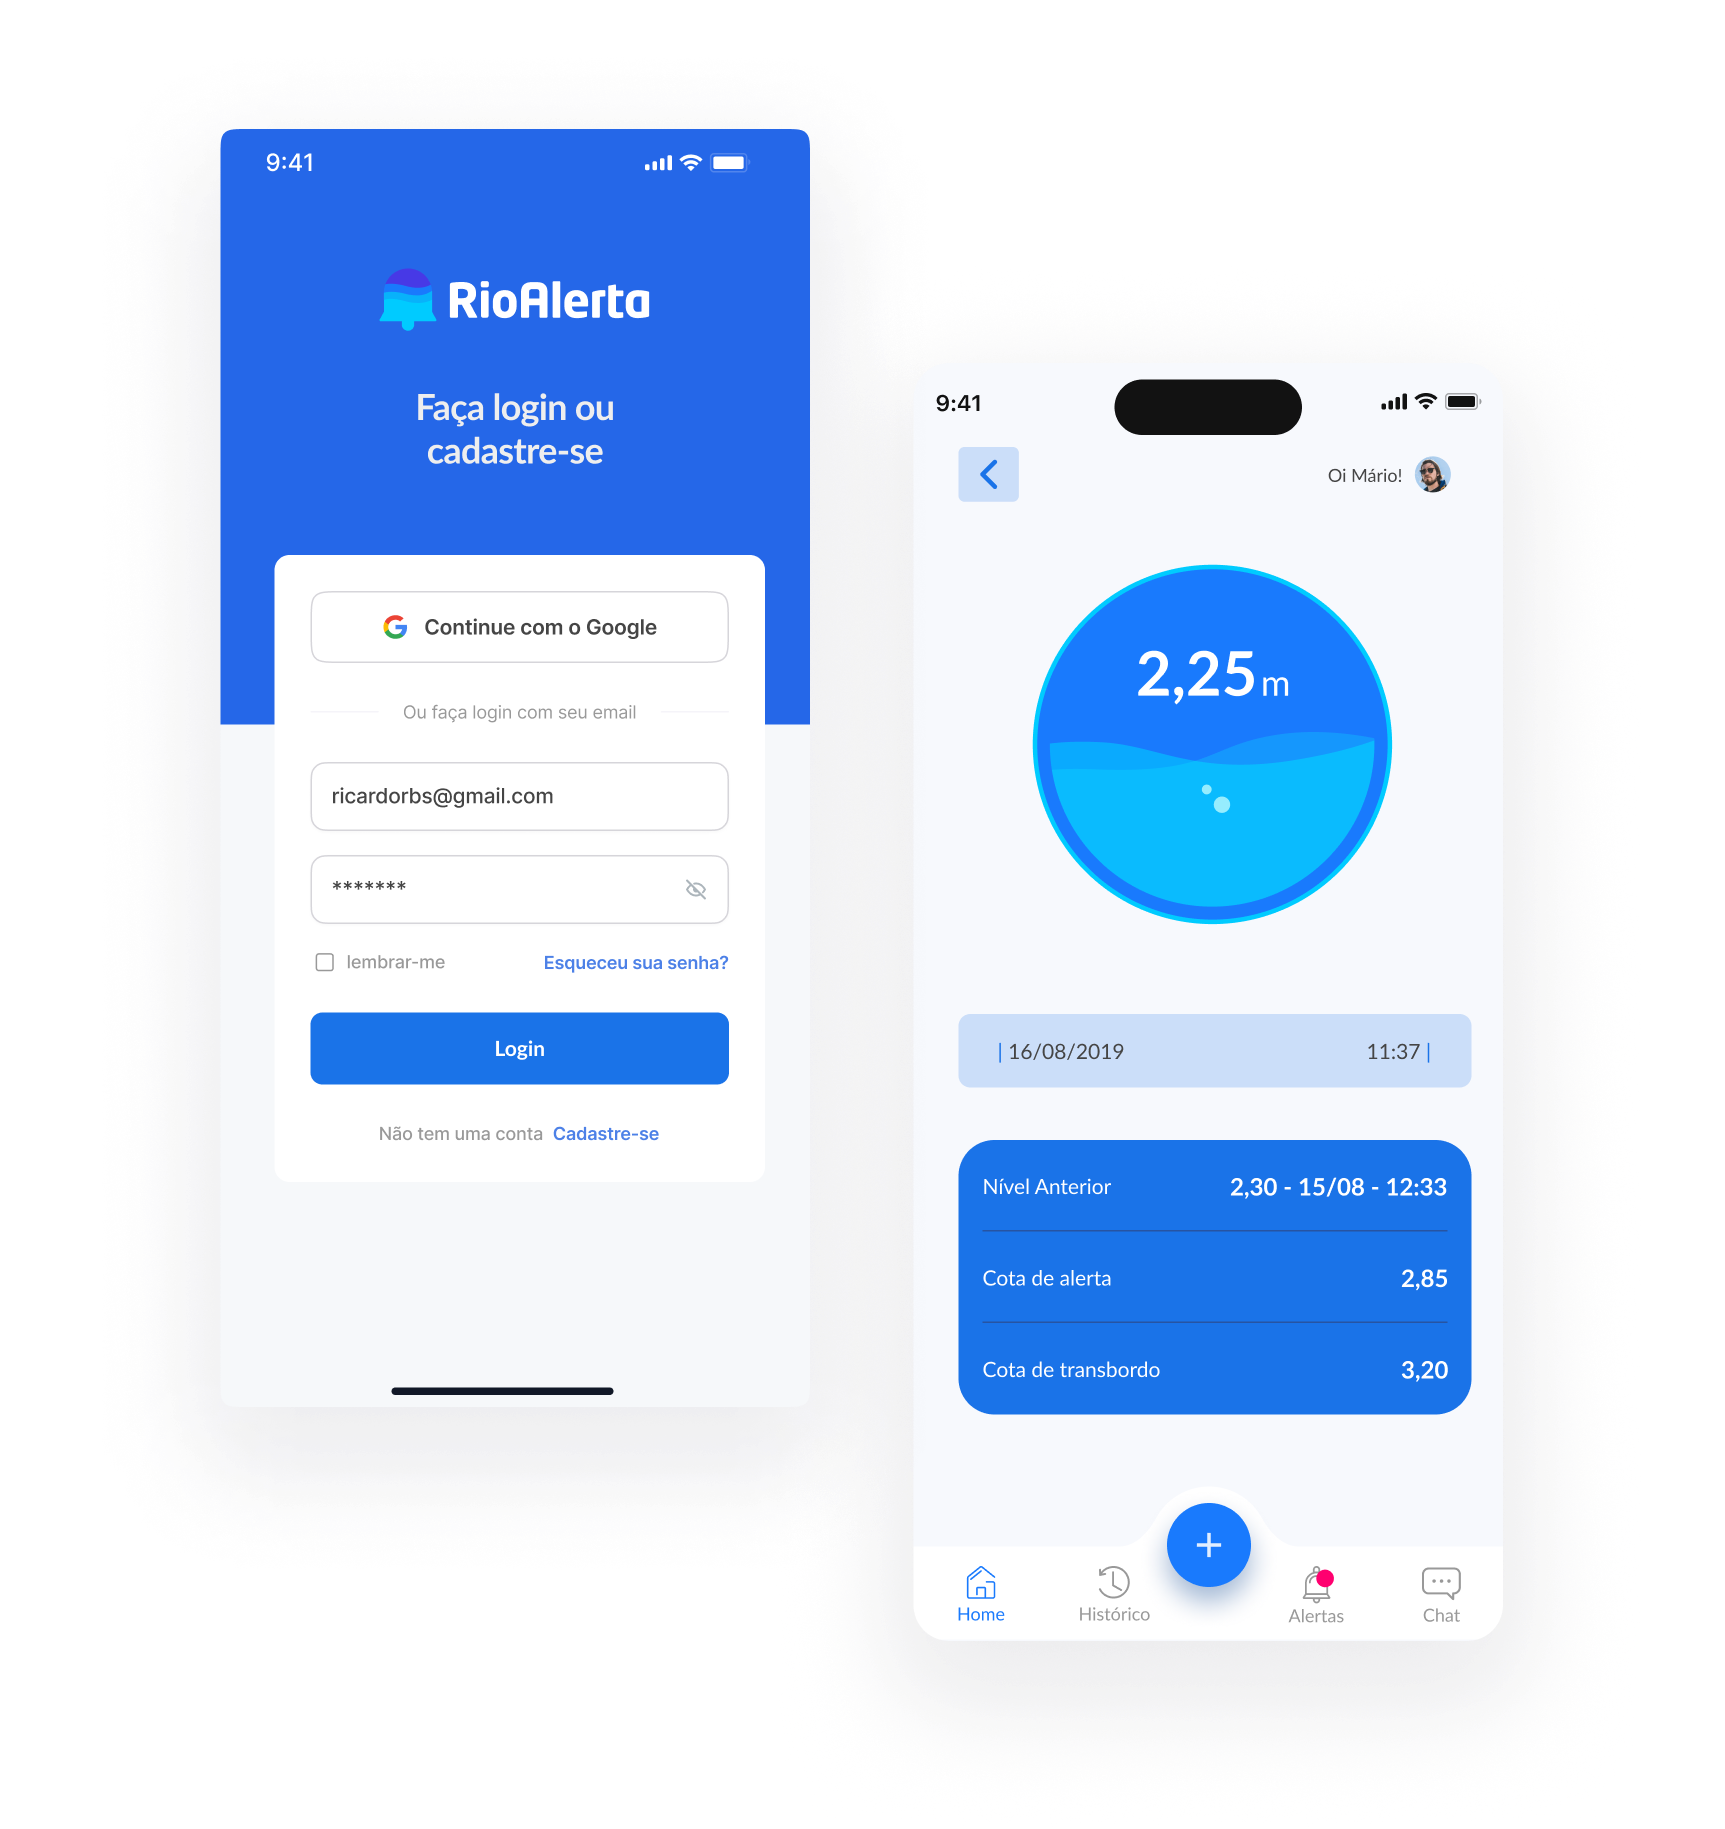
Login and Home
To simplify access and reduce friction during the first use, the app allows users to register using an email address or their Google account. The integration with Google social login was a strategic decision, considering that most users already have a Google account linked to their device, which speeds up the authentication process and enhances the initial user experience.
On the home screen, the user sees the current river level prominently displayed, along with essential supporting information: the previously recorded level, the alert threshold — which serves as a reference to indicate when the situation starts becoming critical — and the overflow threshold. The latter is a fixed value that indicates the point at which certain areas begin to flood. This information is presented in a clear and accessible way, allowing users to monitor the evolving situation in real time and make safer, more informed decisions.
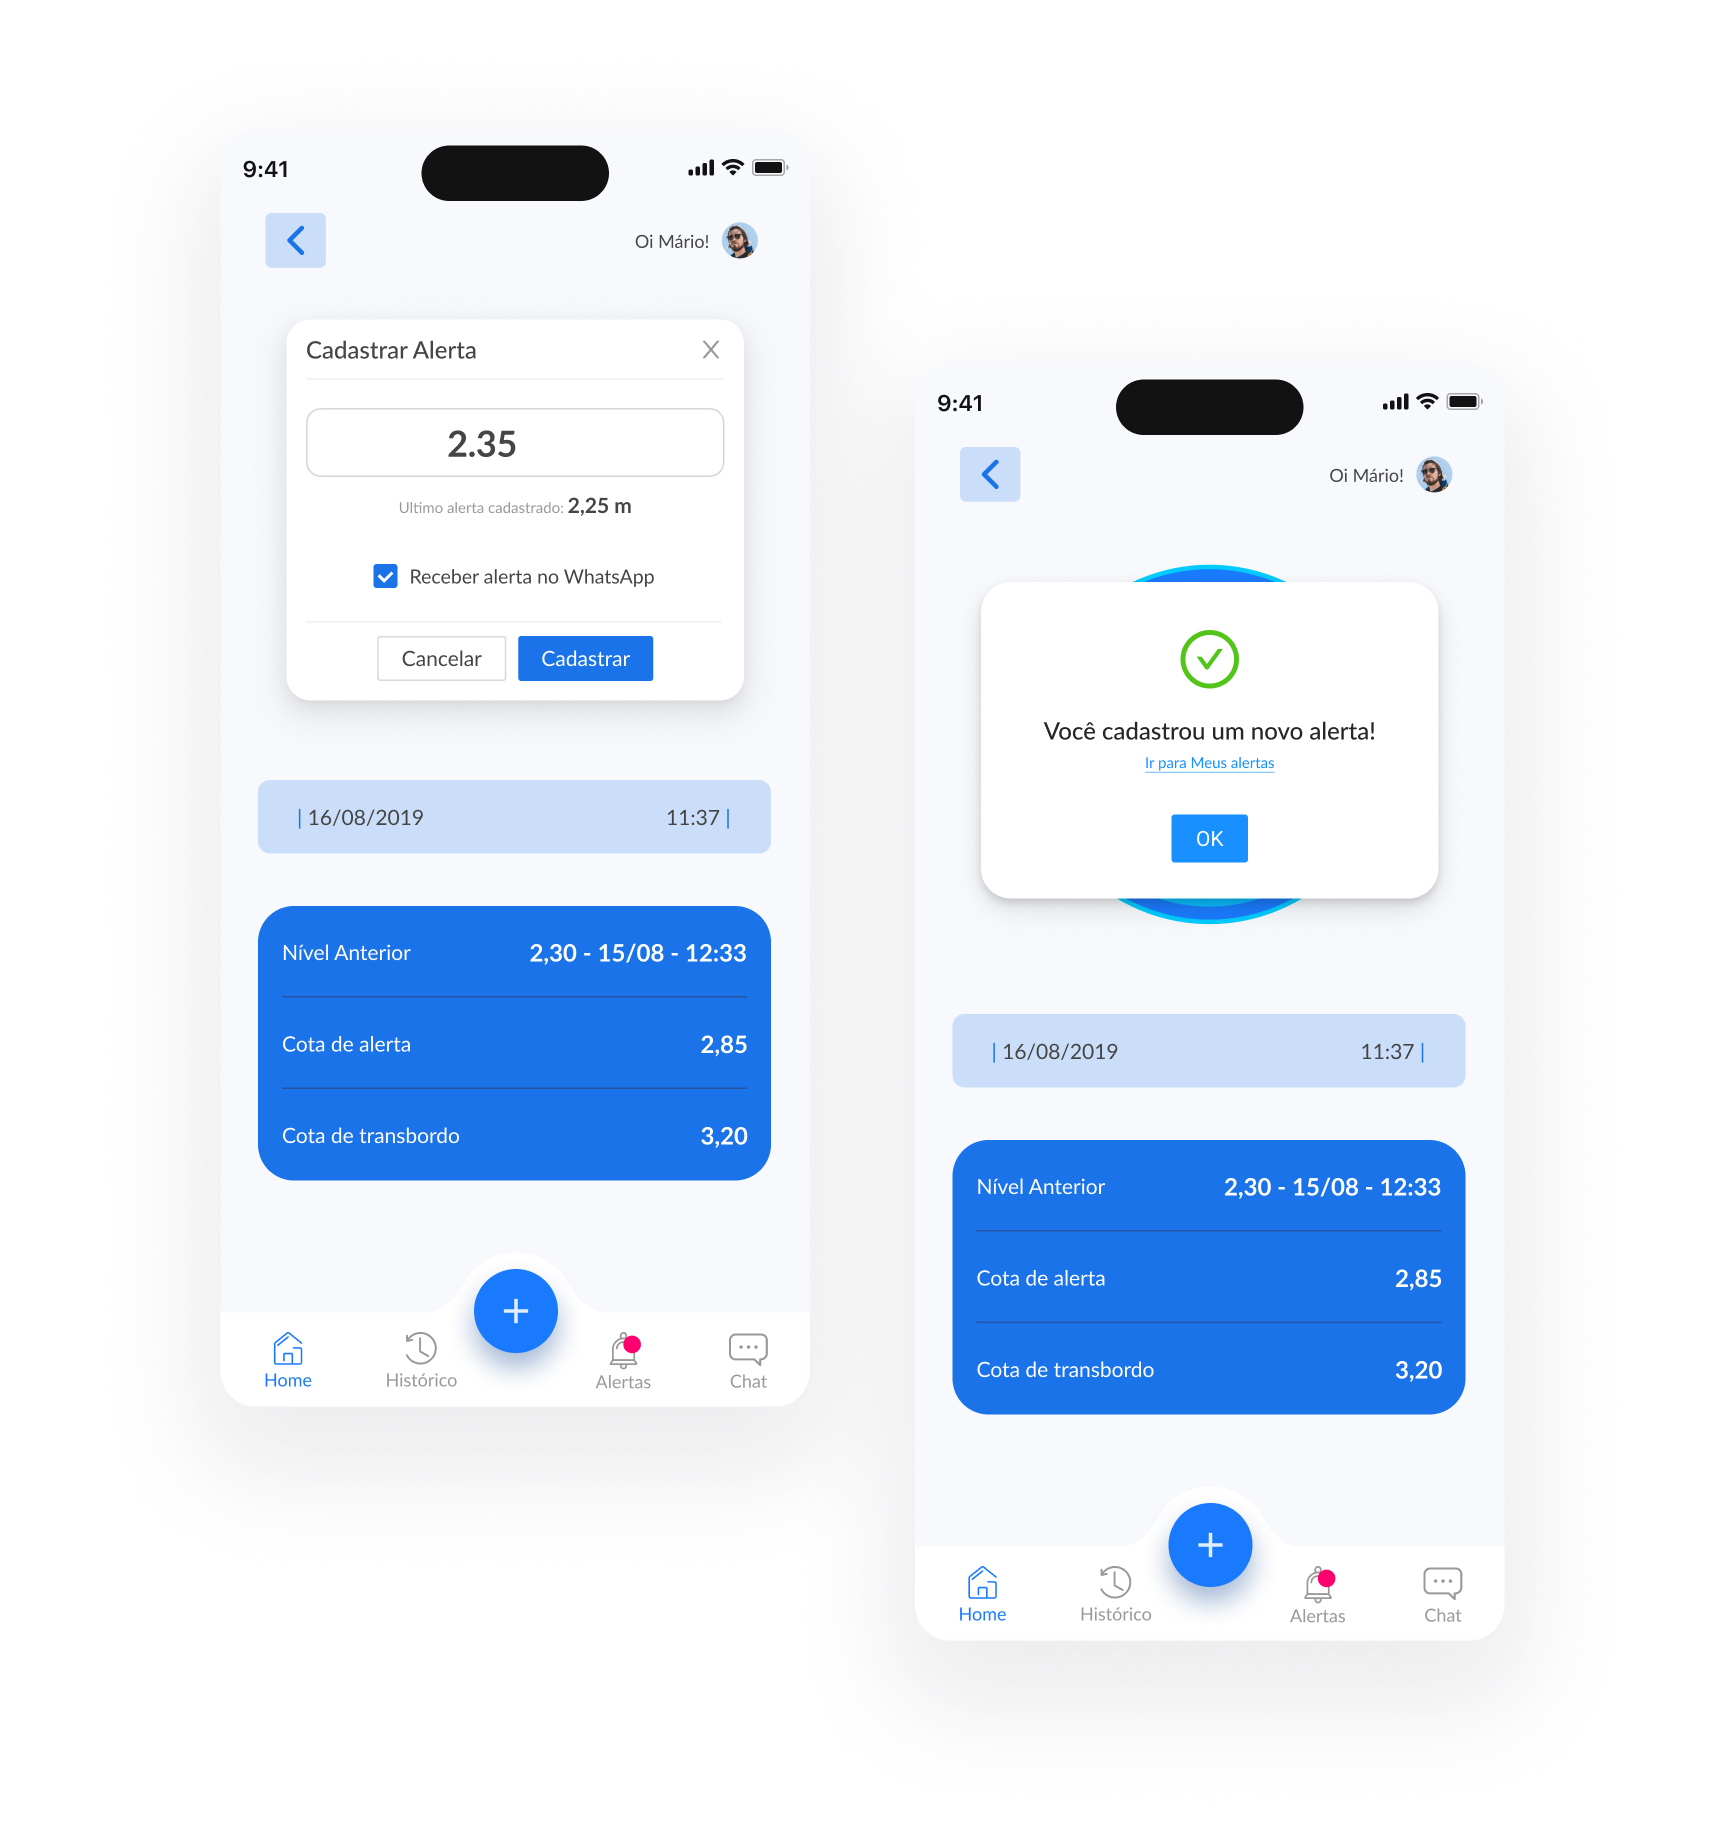
Custom Alert Registration
The app allows users to set up an alert based on a specific river level. Once that value is reached, they receive an automatic notification, which can be sent either through the app or via WhatsApp, ensuring greater safety and information reach.
The alert setup interface is simple and straightforward: the user enters the desired value, views the last registered alert as a reference, and confirms the registration with a single click. Afterwards, a confirmation message reinforces that the alert was successfully created.
This feature makes the experience more personalized and helps users anticipate potential risks related to rising river levels.
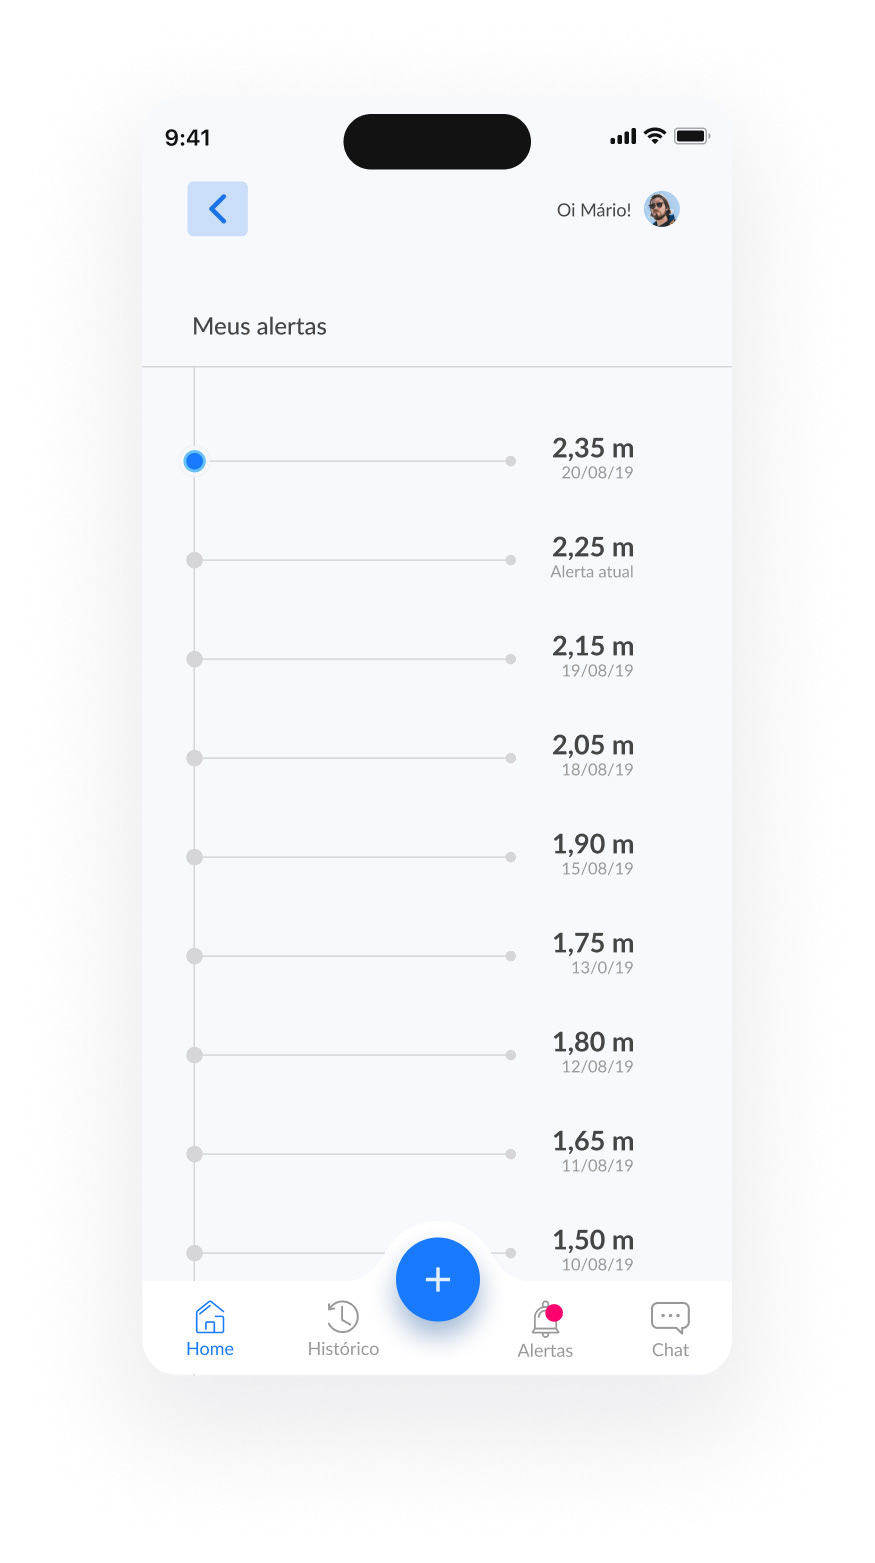
Alert History
On this screen, the user can view all previously registered river level alerts, organized in chronological order. Each item displays the set value in meters, along with the registration date. The most recent alert is visually highlighted, making it easier to identify the current monitoring status.
This feature provides transparency and control, allowing users to track their own risk perception over time and adjust their criteria as the situation evolves.
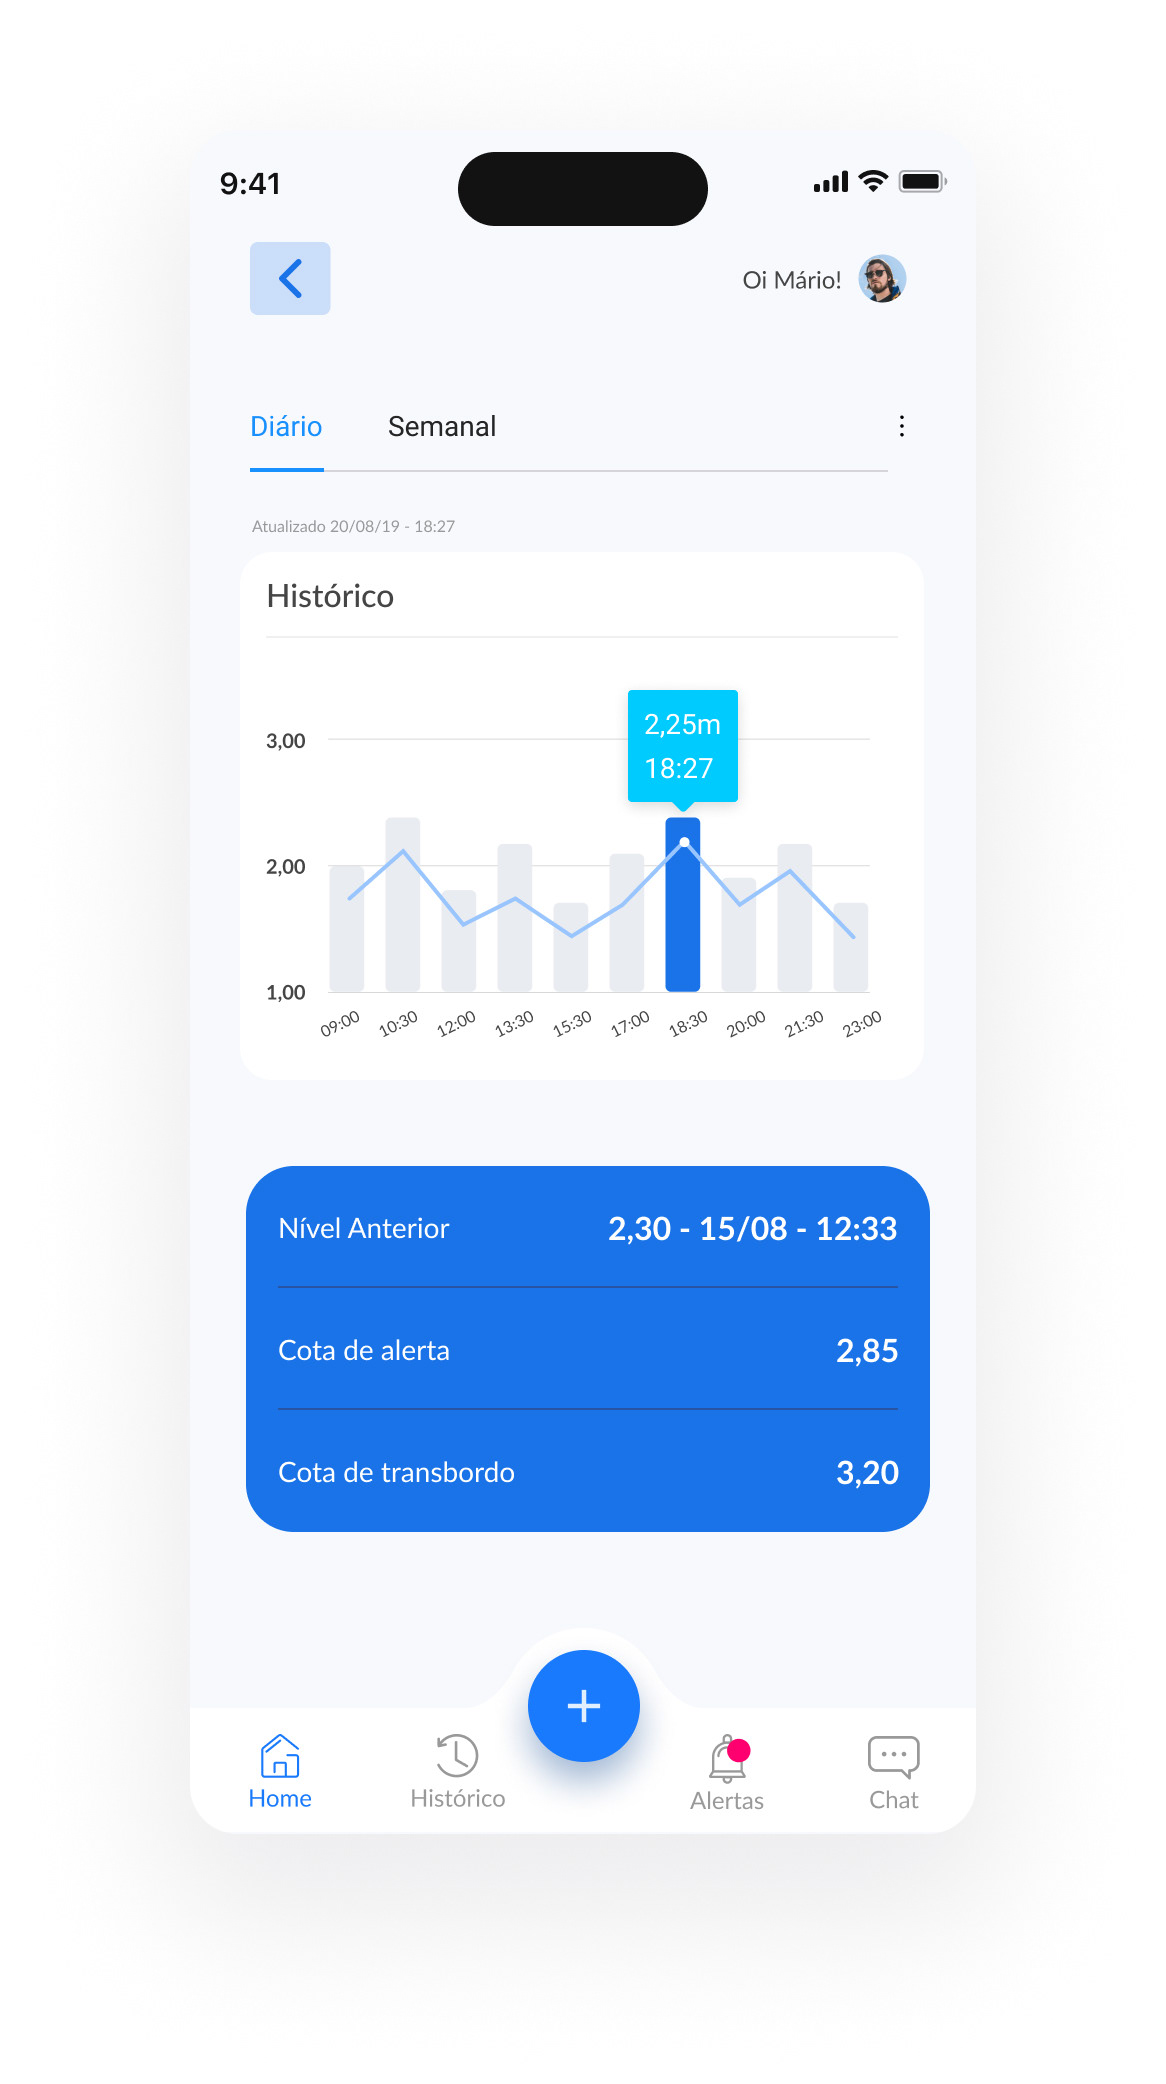
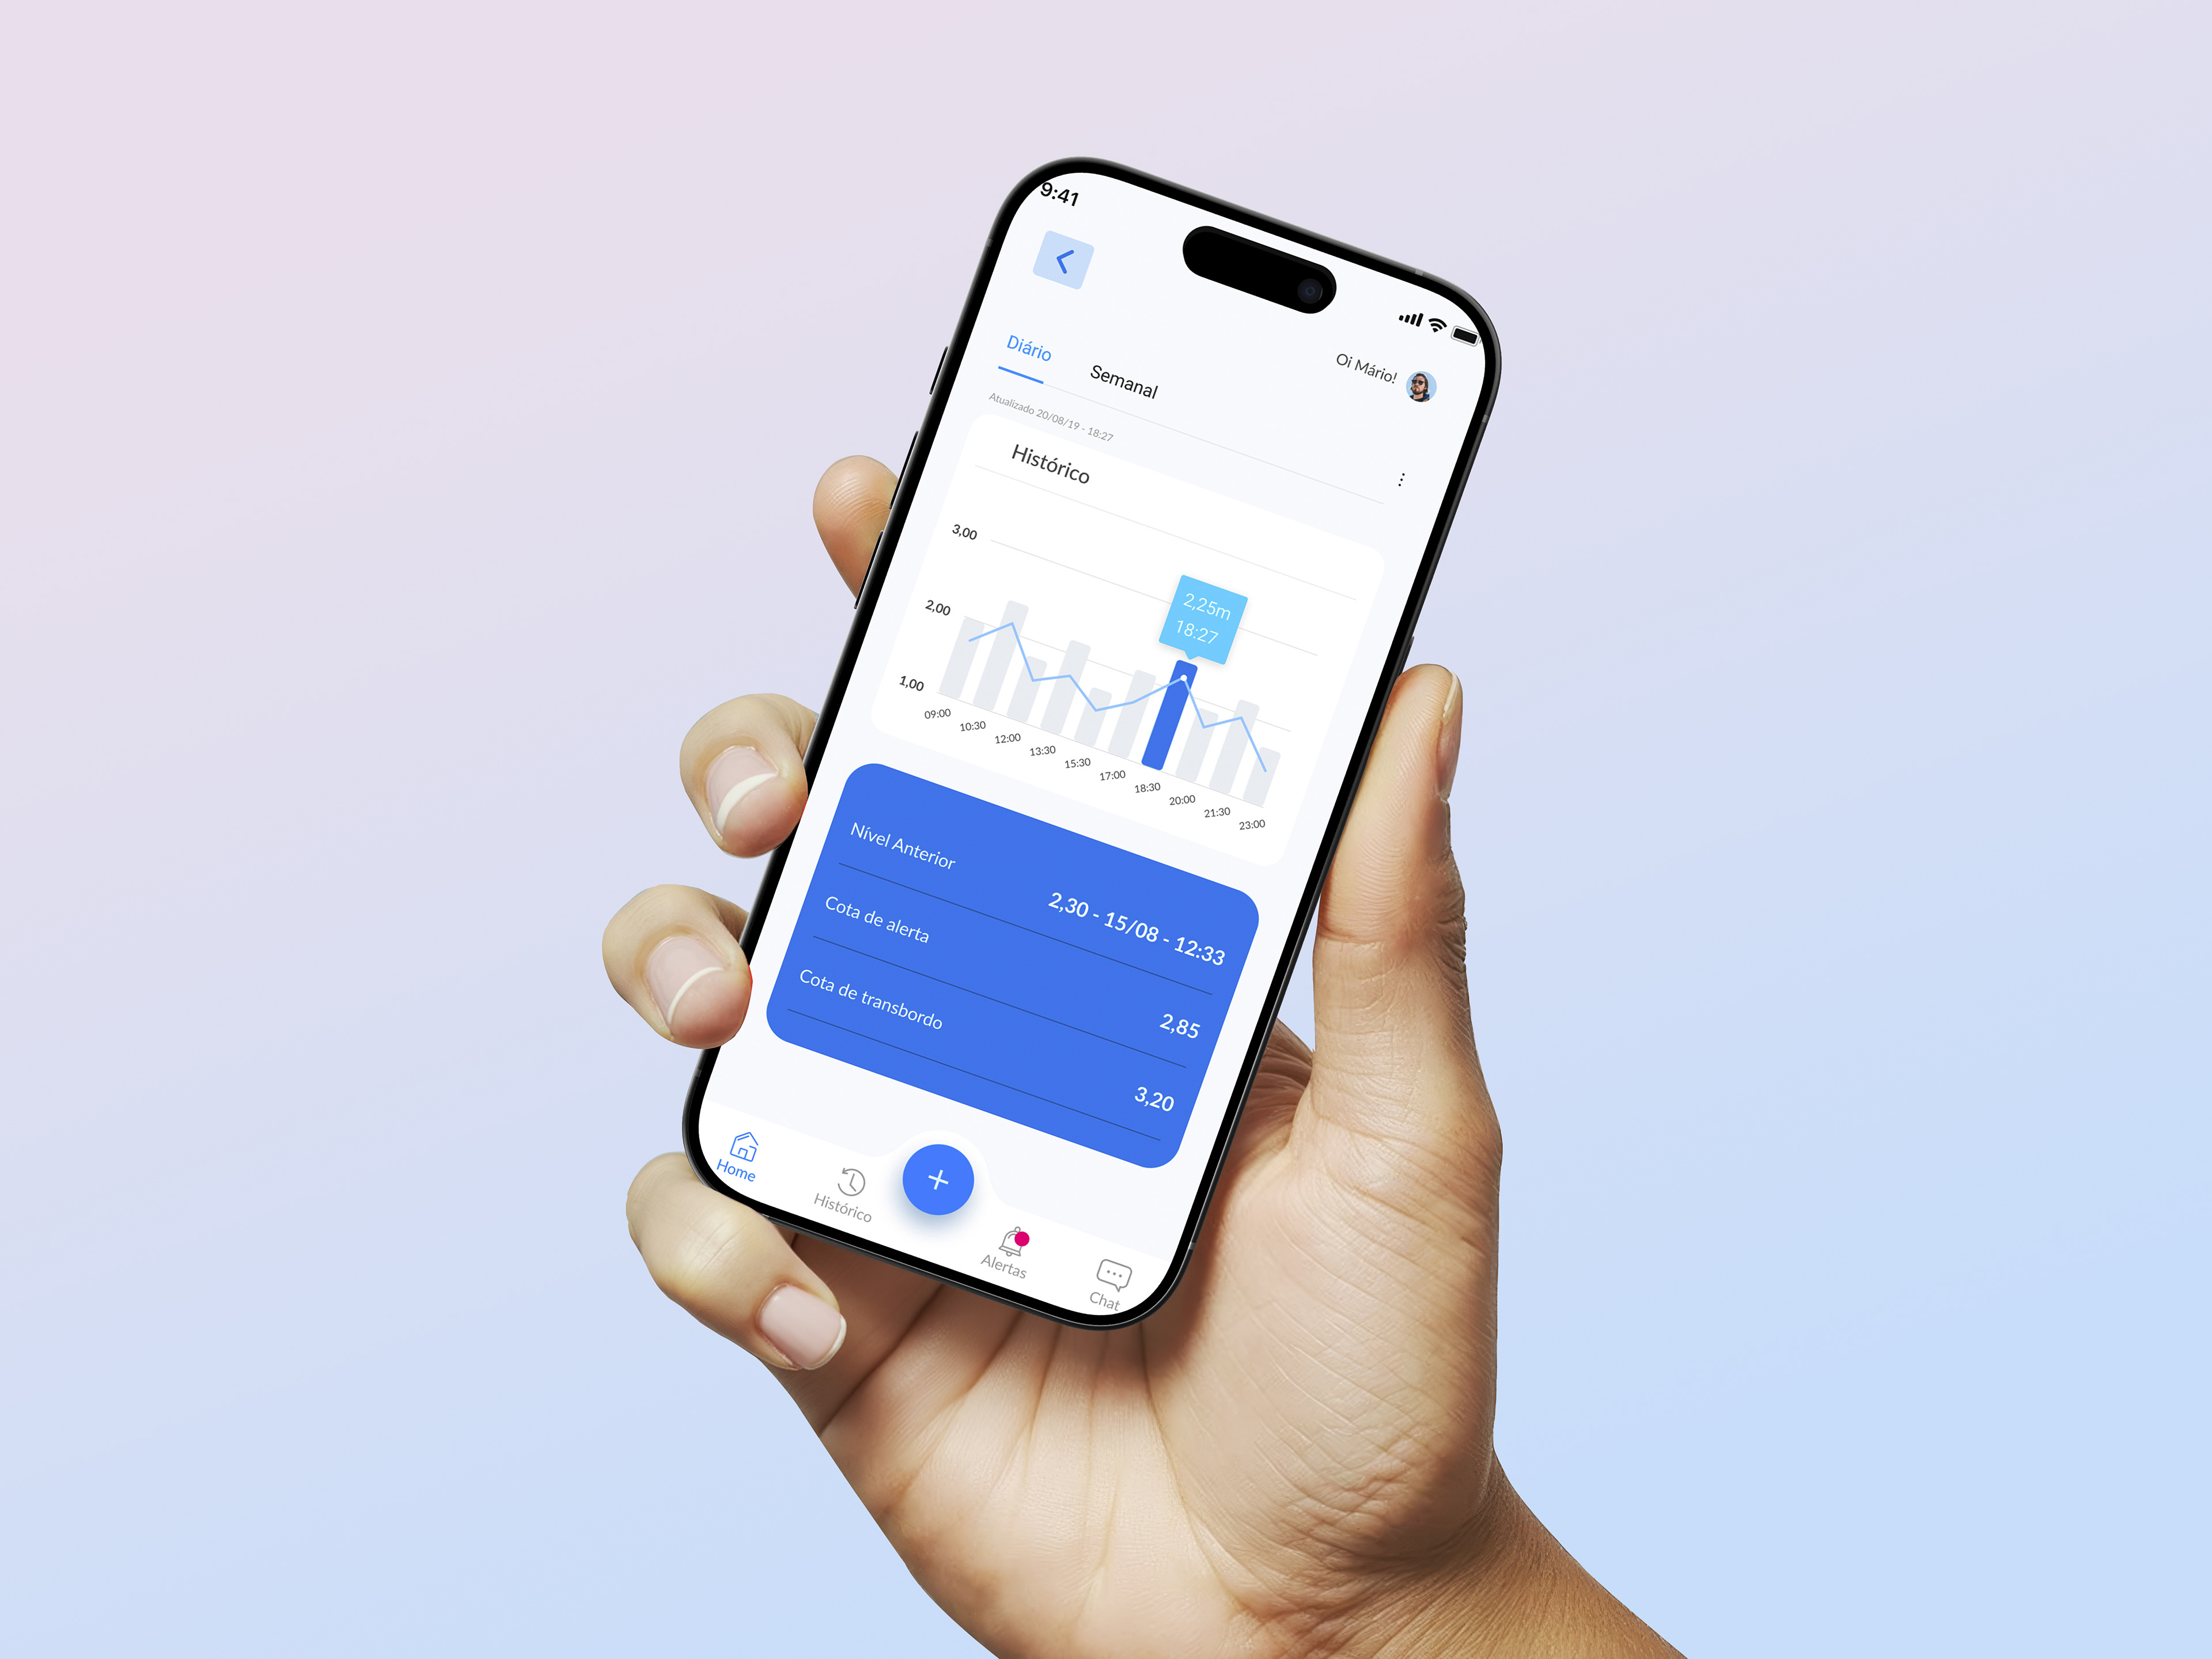
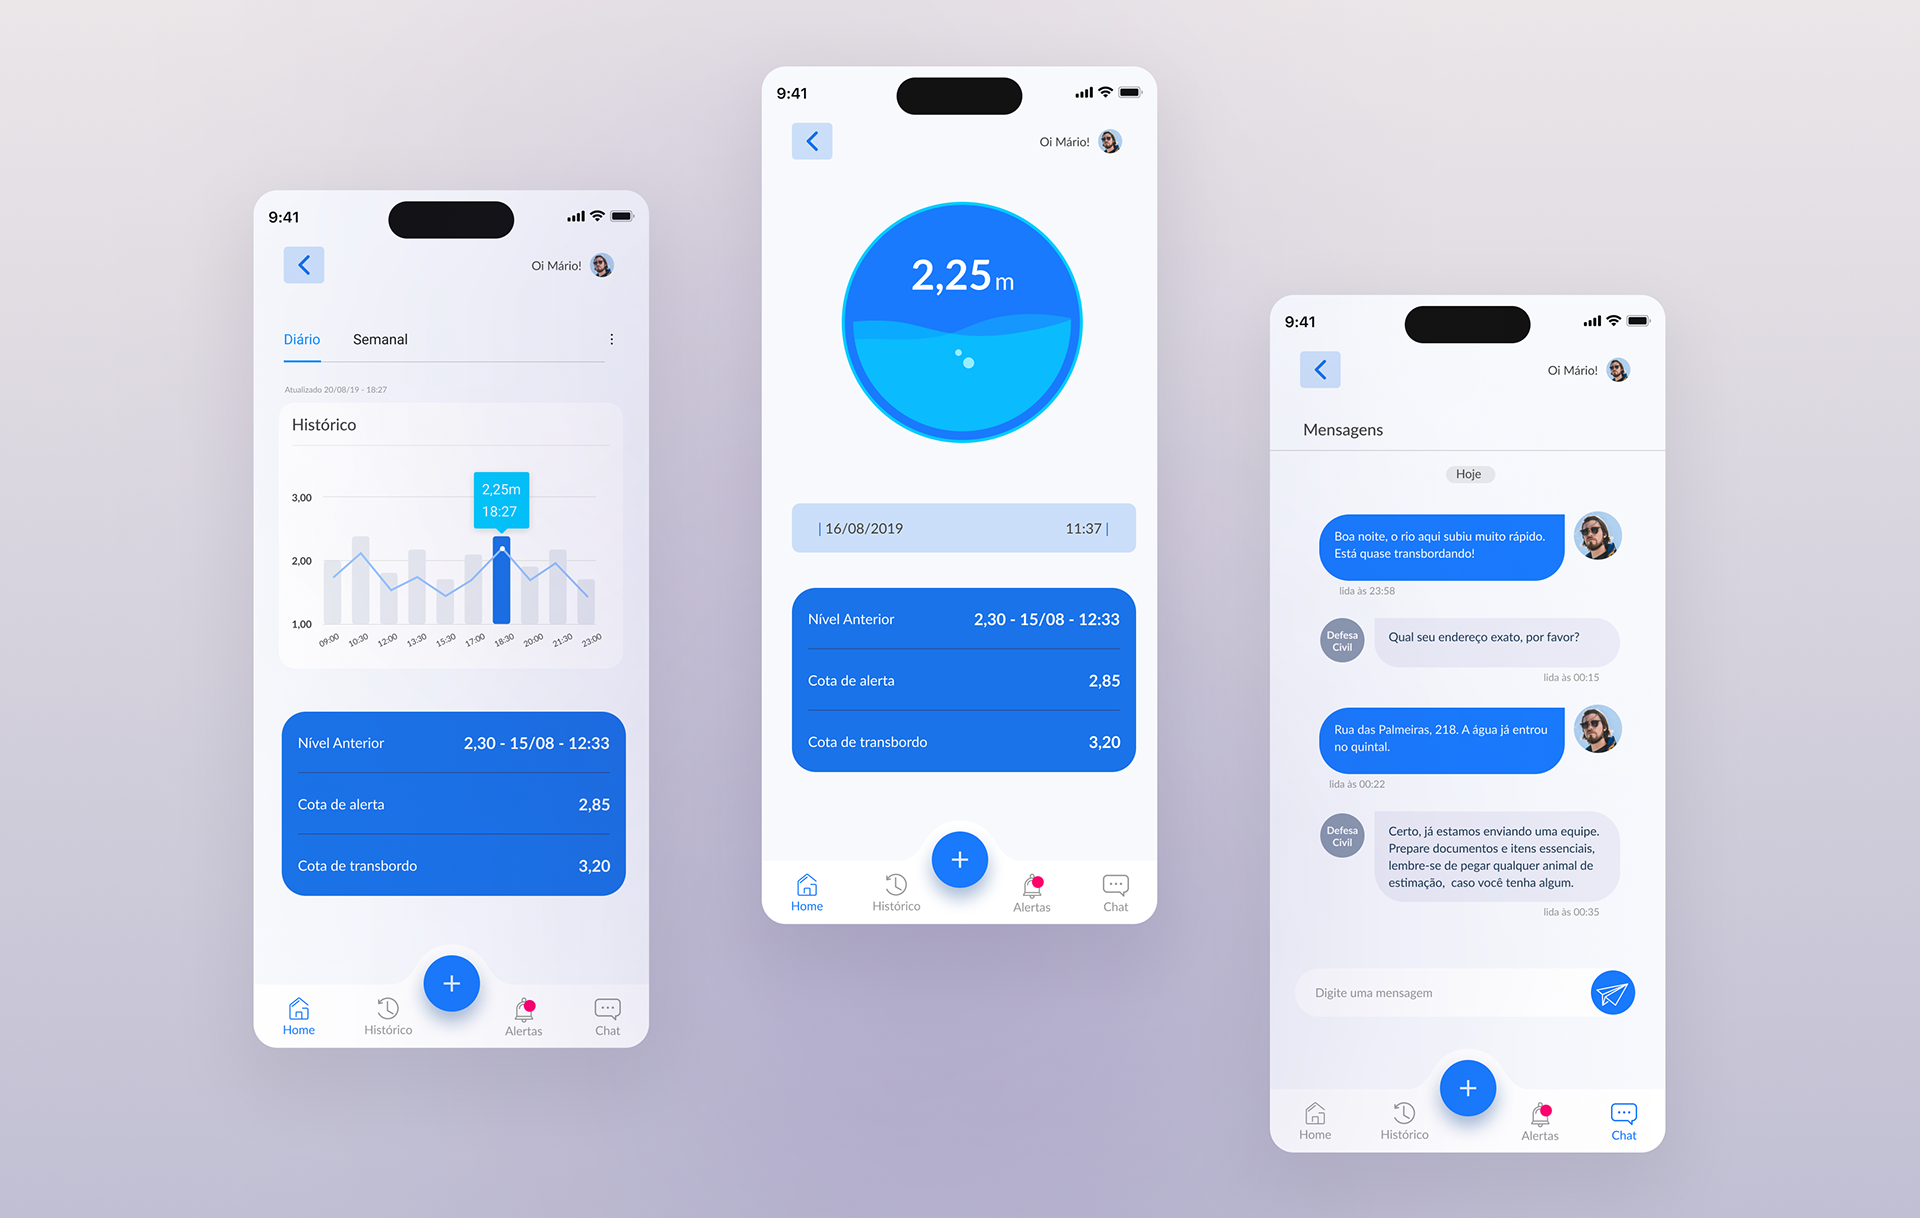
River level history
The app provides an essential tool for monitoring river levels, allowing users to track historical variations through an intuitive bar chart. The visualization can be adjusted by day or week, offering a detailed analysis of changes over time.
The interface is simple and straightforward, highlighting the current river level and providing additional information such as the last recorded level, the alert threshold, and the overflow threshold. These data points help users better understand the river’s situation and make informed decisions, whether for personal safety or preventive planning.
Additionally, the navigation menu makes it easy to access other app features, ensuring a smooth and efficient user experience. With this tool, users can anticipate potential risks and monitor trends in a clear and accessible way.
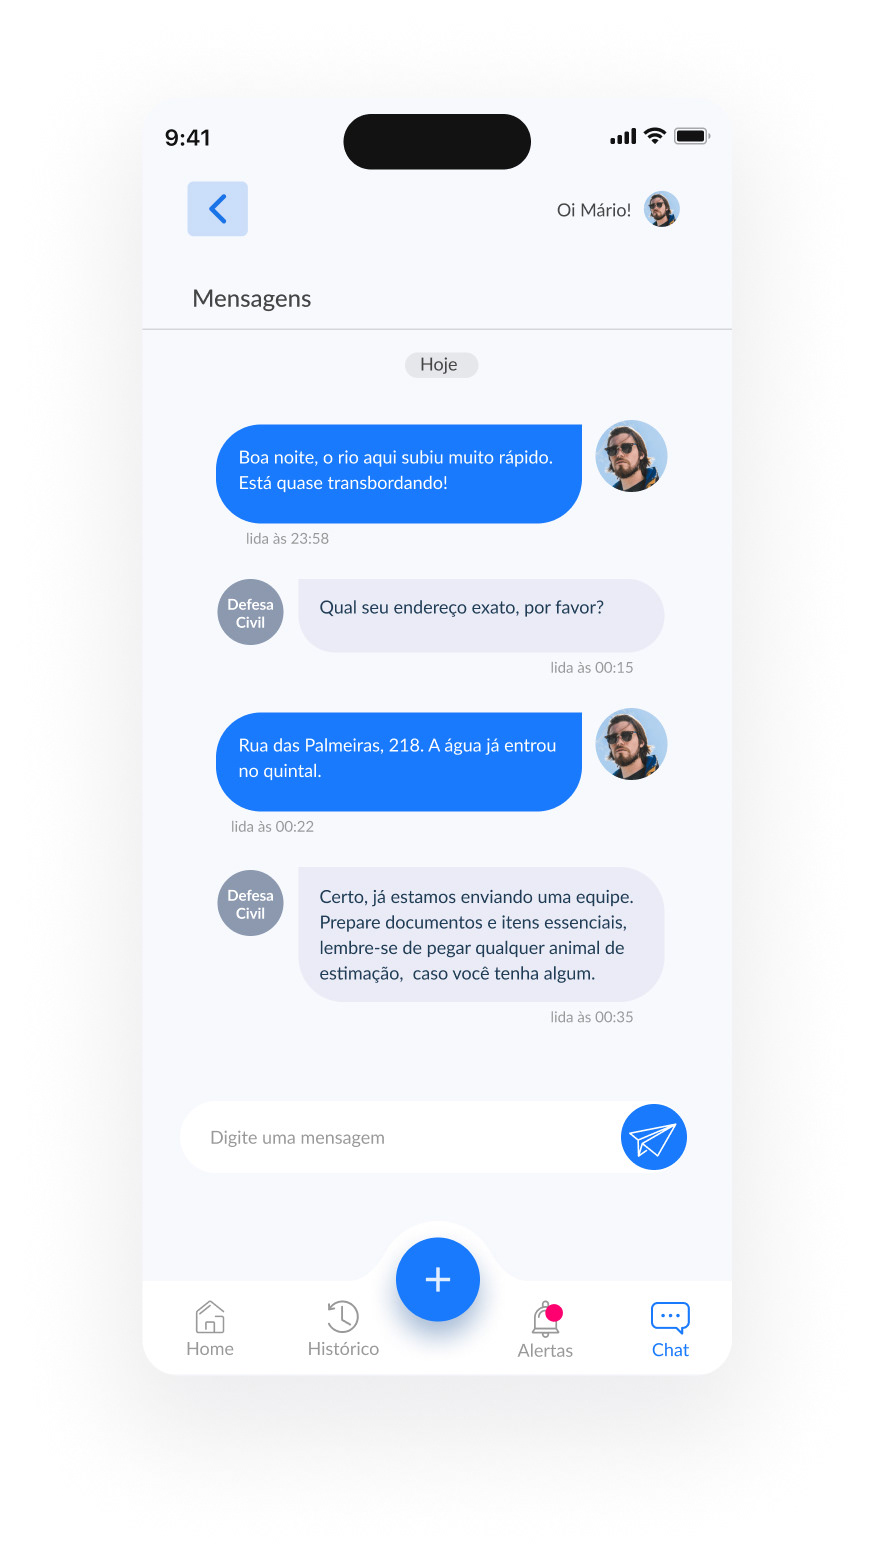
Direct Channel with Civil Defense
This feature allows the user to communicate directly with Civil Defense through a chat integrated into the app. Through this channel, it is possible to report emergencies, share important information, and receive real-time instructions from the responsible team.
Additionally, Civil Defense can also use this space to send alert messages and preventive guidance, offering faster and more personalized support in critical situations.
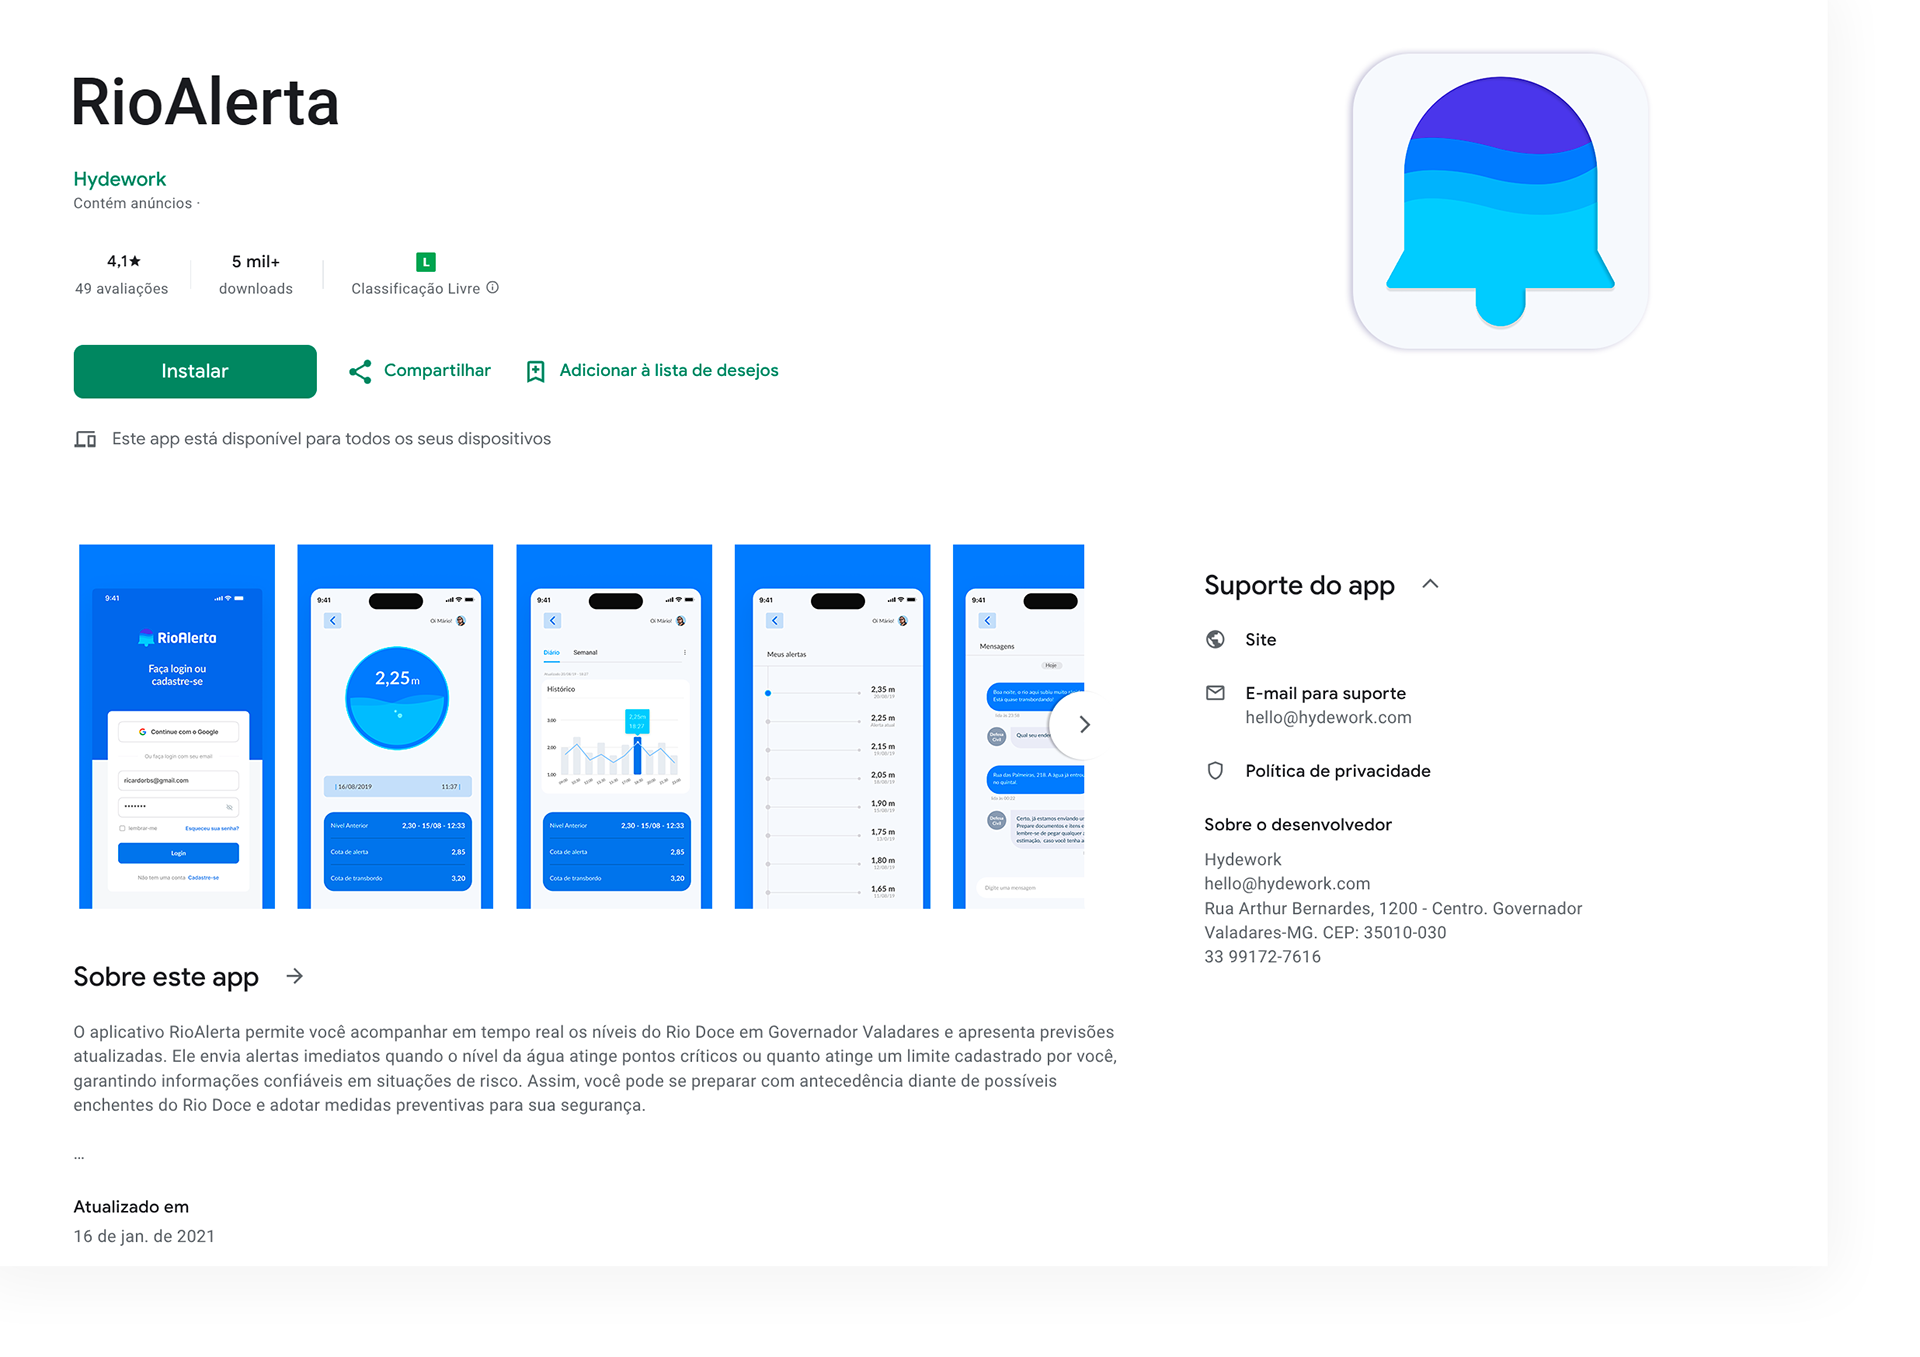
Publication and Results
During the field testing period, the application reached over 5,000 downloads, demonstrating significant interest from the population living along the riverbanks. The tool received an average rating of 4.1 stars, reflecting both the perceived usefulness by residents and some improvement points that emerged from its real use in risk situations.
The project remained active for about two months. However, it had to be discontinued after that period, as the sonar responsible for monitoring the river level — which provided data to the SAAE website — broke down. This failure directly impacted the continuity of the service, since real-time measurements were the main source of information for the app’s alerts.